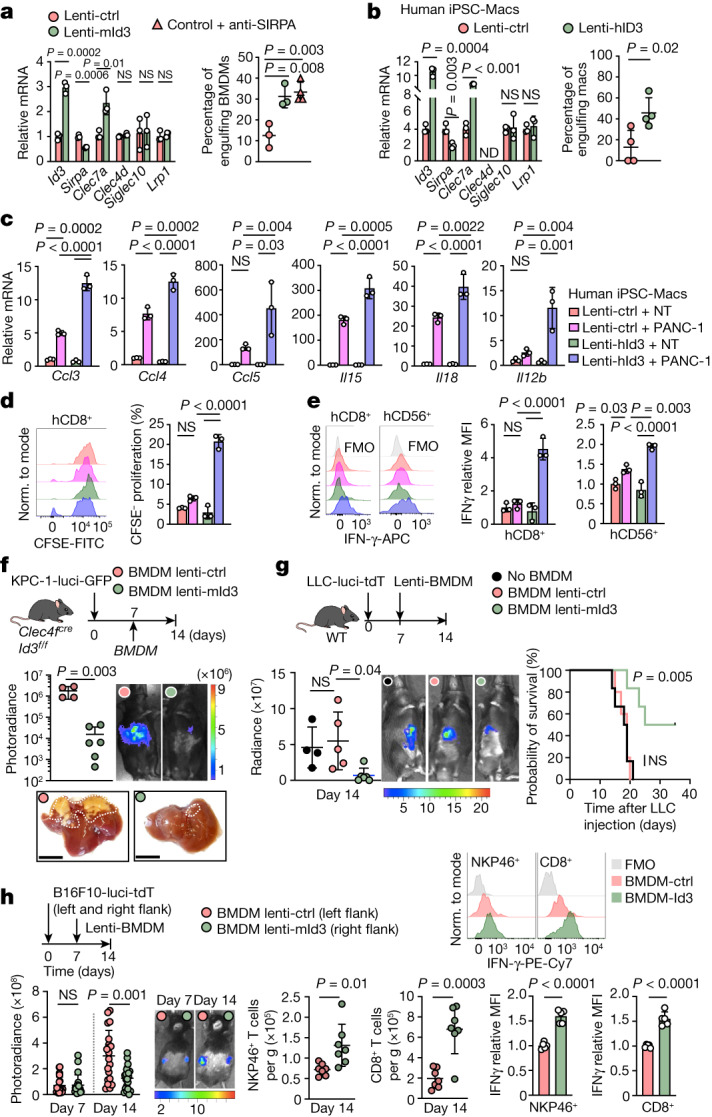
Fig. 6. ID3 expression endows macrophages with anti-tumour activity.

a, Left, RT–qPCR analysis of the indicated genes in mouse BMDMs expressing lenti-mouse-Id3 (Lenti-mId3) or lenti-control (Lenti-ctrl). n = 3 independent experiments. Right, in vitro engulfment of Cas-Green− KPC-1-mtdT cells by mouse BMDMs expressing lenti-mId3 (n = 3) or lenti-control with or without anti-SIRPA blocking antibodies (n = 3 and 4). b, RT–qPCR analysis of the indicated genes. Right, engulfment of Cas-Green− PANC-1-mtdT cells by hiPSC-Macs expressing lenti-human-ID3 (lenti-hID3) or lenti-control. n = 4 experiments. c, RT–qPCR analysis of chemokines and cytokines in hiPSC-Macs expressing lenti-hID3 or lenti-control, cultured alone or with PANC-1 cells for 48 h. NT denotes macrophages that were not cultured with PANC-1 cells. n = 3 experiments. d,e, Flow cytometry analysis of the proliferation of human CD8+ T cells (d) and IFNγ expression by human CD8+ T cells and CD56+ NK cells (e) that were cultured with supernatants from hiPSC-Mac–PANC-1 cell cocultures in c. n = 3 experiments. f, Liver pictures and bioluminescence analysis of the liver tumour burden of Clec4fcreId3f/f mice 2 weeks after intraportal injection of 1 × 10⁶ KPC-1-luci cells and intraportal injection of 1 × 10⁶ BMDMs expressing lenti-control (n = 4) or lenti-mId3 cells (n = 6) at D7. Scale bars, 1 cm. g, C57BL/6J mice received 1 × 10⁶ LLC1-luci cells by intraportal injection at D0, and 1 × 10⁶ BMDMs expressing lenti-control or lenti-mId3, or PBS at D7. Left, bioluminescence analysis of liver tumour burden at D14. n = 4 (PBS), n = 5 (BMDMs + lenti-control) and n = 6 (BMDMs + lenti-mId3). Right, survival analysis. n = 6, 5 and 6 mice per group, respectively. h, C57BL/6J mice received subcutaneous injection of 1 × 10⁶ B16F10-luci-tdT cells into the left and right flanks at D0 and intratumour injection of 5 × 10⁵ BMDMs expressing lenti-control or lenti-mId3 cells at D7. At D14, the flank tumour burden was analysed by bioluminescence (n = 20 mice per group; left), and the recruitment of NKP46+ NK and CD8+ T cells (n = 7 mice per group; middle) and IFNγ production (n = 5 mice per group; right) were analysed using flow cytometry. Statistical analysis was performed using one-way ANOVA (a, c–e and g (left)), log-rank (Mantel–Cox) tests (g (right)), two-tailed Mann–Whitney U-tests (h) and unpaired two-tailed t-tests (a, b, f and h). Data are mean ± s.d.
