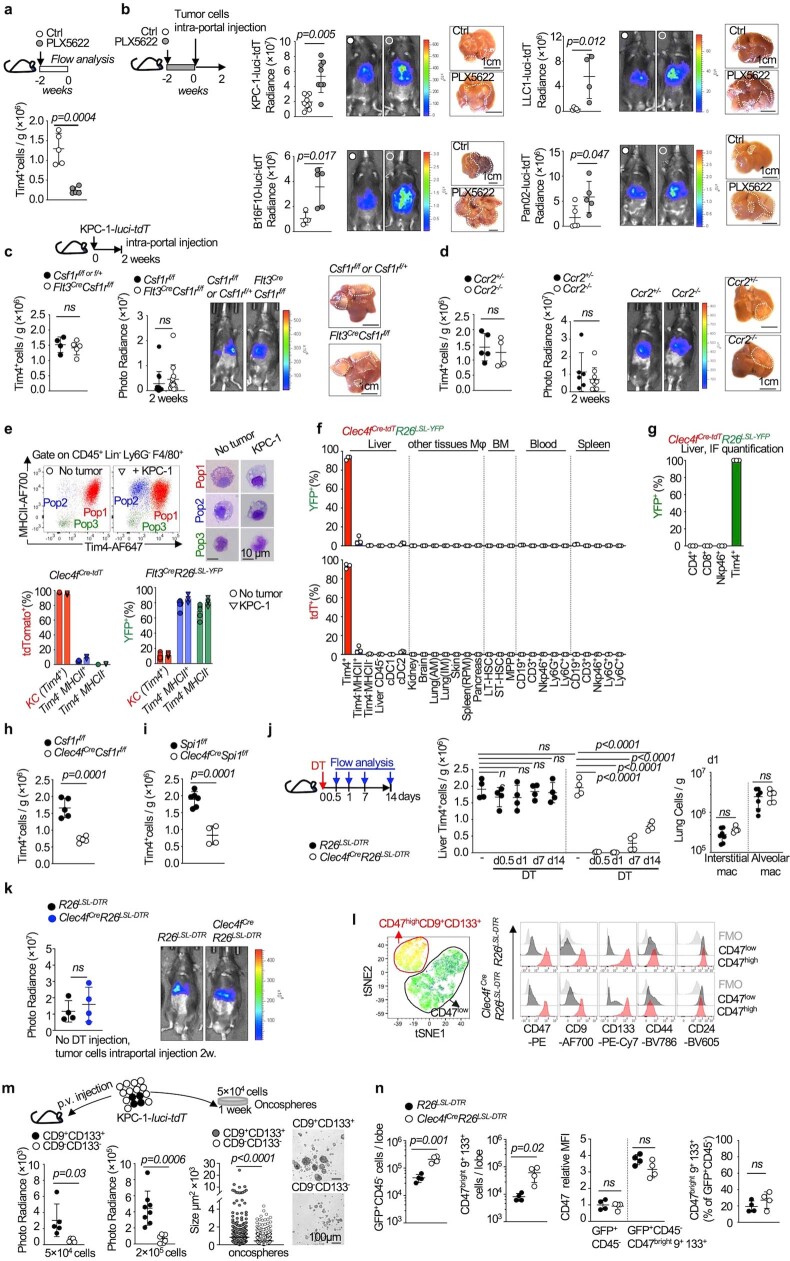
Extended Data Fig. 1. Related to Fig. 1. Targeting of Kupffer cells in tumour models.
a- Kupffer cell number (Tim4+ F4/80+, see methods) analysed by flow cytometry in 6 to 8 weeks-old C57BL/6 J mice treated with the Csf1r small molecule antagonist PLX5622 food, or control food for 2 weeks, n = 5 mice per group. b- Photoradiance and histology analysis of liver tumour burden in 6–8 weeks-old C57bl/6j mice (n = 7) pretreated with PLX5622 Csf1r small molecule antagonist food or control food for 2 weeks, followed by intra-portal injection of 1 × 10⁶ cells from the, KPC-1-luciferase (n = 9 and 8 for control and PLX respectively), LLC1-luciferase (n = 5 and 5) or Pan02-luciferase (n = 5 and 4) tumour cell lines or 3 × 10⁵ cells from the B16F10-luciferase line (n = 5 and 5), Results are obtained from 2-3 independent experiments per cell lines. c,d- Flow cytometry analysis of Tim4+ KCs numbers, photoradiance analysis of tumour burden, and representative liver micrographs from 6-8 weeks old Flt3CreCsf1rf/f mice (n = 4, 13), Csf1rf/f littermates (n = 5, 13), or CCR2−/−mice (n = 5, 6) and Ccr2+/− littermates (n = 4, 9). two weeks after intra-portal injection of 1 × 10⁶ KPC-1-luciferase cells. Results are obtained from 3 independent experiments. e- flow cytometry and cytospin giemsa stain analysis of Kupffer cells (pop1: F4/80+Tim4+), and other myeloid cells (pop2: F4/80+Tim4−MHCII+ and pop3: F4/80+Tim4−MHCII−) from the liver of C57BL/6 J mice 2 weeks after intra-portal injection of 1 × 10⁶ KPC-1-luci-tdT cells. The bar plot represents the % of cells from each population that are labelled by tdT in the liver of Clec4fCre-tdT mice (n = 3/group) and by YFP in the liver of Flt3CreR26LSL-YFP mice (no tumour n = 6, KPC-1 n = 4) 2 weeks after intra-portal injection of 1 × 10⁶ KPC-1 cells or in the absence of tumour injection. f- Genetic labelling efficiency in 8 weeks old Clec4fCre-tdTR26LSL-YFP mice, %YFP+ and % tdT+ cells are measured by flow cytometry in liver myeloid cells: Tim4+ KCs, F4/80+Tim4−MHCII+, F4/80+Tim4−MHCII−, cDC1, cDC2), liver CD45− cells, tissue macrophages: kidney macrophages, brain macrophages, lung alveolar macrophages (AM), lung interstitial macrophages (IM), skin macrophages, splenic red pulp macrophages (RPM), bone marrow long term HSCs (LT-HSC), short term HSCs (ST-HSC), multipotent progenitor MPP, blood and spleen CD19+ B cells, Ly6G+ granulocytes, Ly6C+ monocytes, CD3+ T cells (see methods). n = 3 mice per group. g- Percentage of YFP+ cells among CD4+ T cells, CD8+ T cells, Nkp46+ NK cells, Tim4+ KCs on liver cryosection from 8 weeks old Clec4fCre-tdTR26LSL-YFP mice. n = 3 mice per group. h,i- Flow cytometry analysis of Tim4+ KCs numbers in 6-8 weeks-old Clec4fCreCsf1rf/f mice (n = 5) or Csf1rf/f littermates (n = 5) (h), Clec4fCreSpi1f/f mice(n = 4) or Spi1f/f littermates(n = 6) (i). j- Six to 8 weeks-old Clec4fCre R26LSL-DTR mice and R26LSL-DTR mice are injected with DT, liver Tim4+KCs numbers (n = 4/group), lung interstitial macrophages and alveolar macrophages numbers (n = 7,5 respectively) are quantified by flow cytometry at indicated time point after DT injection. k- Photoradiance analysis of tumour burden in 6-8 weeks old Clec4fCreR26LSL-DTR mice and R26LSL-DTR littermates 2 weeks after intra-portal injection of 1 × 10⁶ KPC1-luciferase cells, n = 4 mice per group. l- Representative tSNE and histogram analysis of expression of the markers CD47bright, CD9, and CD133, among GFP+ CD45− tumour cells in Clec4fCre-tdTR26LSL-DTR (n = 4) and Clec4fCre-tdT littermates (n = 4), treated with DT and that received intra-portal injection of 1 × 10⁶ KPC-1 cells 2 weeks before analysis (see methods). Results from 2 independent experiments. m- analysis of metastatic potential of CD47bright CD9+CD133+ tumour cells and CD47low CD9low CD133low tumour cells in vivo by bioluminescent analysis, two weeks after intra-portal injection of 5 × 10⁴ cells (n = 5/group) or 2 × 10⁵ KPC-1-luci-tdT cells (n = 8,7 respectively) (Left, circles represent individual mice), and in vitro clonogenic potential in oncosphere culture (n = 561,563 respectively) (right, circles represent individual oncospheres, see Methods). n- Plots indicate the number of GFP+CD45− cells and of GFP+CD45−CD47brightCD9+CD133+ cells per liver lobe, and the MFI of CD47 in GFP+CD45− cells and GFP+CD45−CD47brightCD9+CD133+ cells, in mice from (l). Statistics: One-way ANOVA (i). unpaired two-tailed t test (a,b,c,d,g,h,i,j,k,m,n). Mann-Whitney test(two-tailed) (m). Dots represent individual mice (a,b,c,d,e,f,h,i,j,k,m,n). mean ± sd. ns, not significant.

