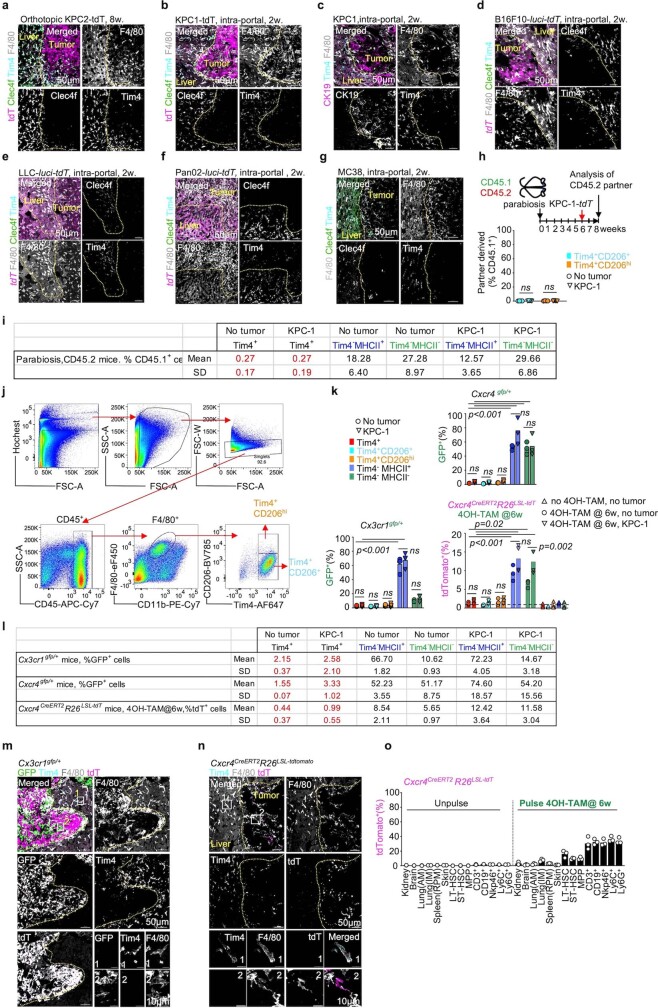
Extended Data Fig. 2. Related to Fig. 2. Anatomical location and turnover of liver macrophages in metastatic liver.
a-g- Representative immunofluorescence staining for Clec4f, F4/80, Tim4, tdT, CK19 on frozen liver sections from wt C57BL/6j mice 8 weeks after pancreatic orthotopic injection of 2 × 10⁵ KPC-2-tdT cells. b-g- idem, from wt C57BL/6j mice 2 weeks after intra-portal injection of 1 × 10⁶ KPC-1-tdT cells, 1 × 10⁶ KPC-1 cells, 5 × 10⁵ B16F10-luci-tdT cells, 1 × 10⁶ LLC1-luci-tdT cells, 1 × 10⁶ Pan02-luci-tdT cells, or 1 × 10⁶ MC38 cells. n = 3 mice per group. h- Flow cytometry analysis of the % of CD45.1+ cells among Tim4+CD206+ KCs and Tim4+CD206hi KCs in the liver of CD45.1/CD45.2 parabiotic pairs 2 weeks after intra-portal injection of 106 KPC-1-tdT in the CD45.2 partner (n = 5), or not injected as control (n = 4). i- table represents the percentage (mean and sd) of CD45.1+ partner-derived cells among Tim4+, Tim4+CD206+, and Tim4+CD206hi KC, and TIM4− TAMs in tumour free and tumour bearing livers from CD45.2 parabionts in (h). j- Gating strategy for separation of Tim4+CD206+ and Tim4+CD206hi liver KC by flow cytometry. k- Bar-plots show the percentage of Tim4+, Tim4+CD206+, Tim4+CD206hi KC, and TIM4− TAMs labelled with GFP in Cxcr4gfp/+ mice (n = 3/group) and in Cx3cr1gfp/+ mice (n = 3/group), and labelled with tdT in Cxcr4CreERT2;R26LSL-tdTomato mice pulsed with 4OH-TAM at 6 week-old, that have received intra-portal injection of 1 × 10⁶ KPC-1-luci-tdT cells 2 weeks before analysis (n = 4), or not injected with tumour cells (n = 3/group), not injected with 4OH-TAM (n = 3/group) as control. l- Table represents the percentage (mean and sd) of Tim4+ KC, Tim4+ CD206+ KC, Tim4+CD206hi KC, and TIM4− TAMs in the liver of tumour free and tumour bearing Cxcr4gfp/+ mice, Cx3cr1gfp/+ mice, and Cxcr4CreERT2;R26LSL-tdTomato mice pulsed at 6 weeks with 4OH-TAM. m- Immunofluorescence staining for F4/80, Tim4, GFP and tdTomato on frozen liver section from Cx3cr1gfp/+ tumour bearing mice in (k). n- immunofluorescence staining for F4/80, Tim4 and tdTomato on frozen liver section from Cxcr4CreERT2 R26LSL-tdTomato tumour bearing mice in (k). o- Cxcr4CreERT2R26LSL-tdTomato mice are pulsed with 4OH-TAM (n = 3) or PBS (n = 2) at 6 weeks and analysed 2 weeks later. Bar graphs represent the % of tdT+ cells determined by flow cytometry among the indicated cell types. Statistics: One-way ANOVA (h,k). Dots represent individual mice. mean ± sd. ns, not significant.

