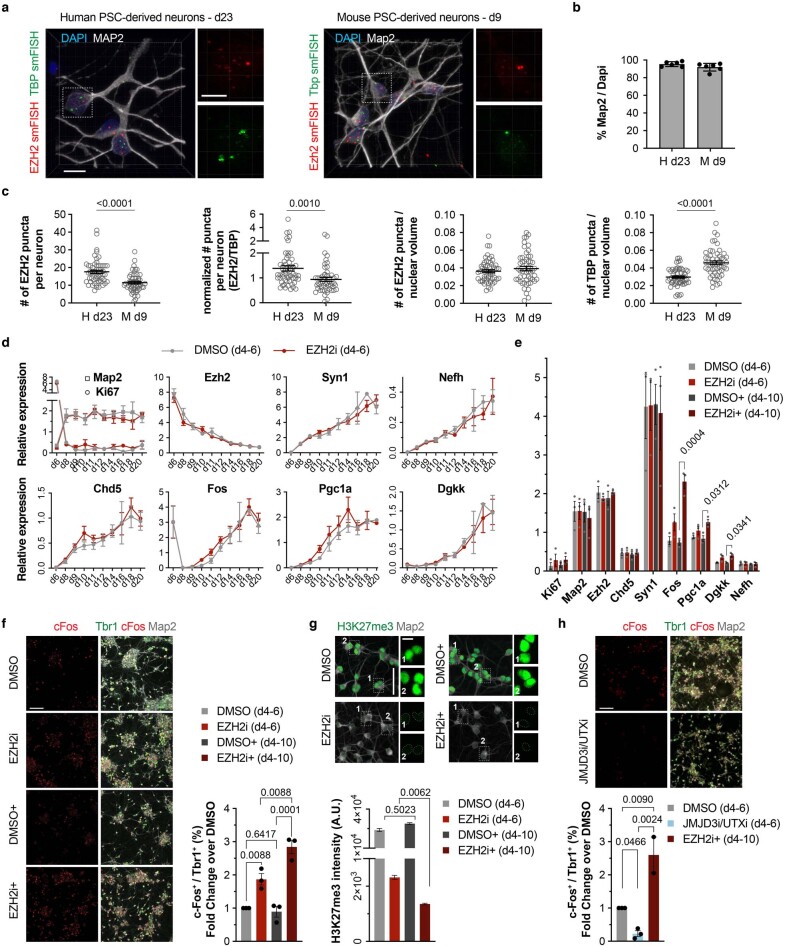
Extended Data Fig. 9. Impact of EZH2i on the maturation of mouse PSC-derived neurons.
a–c, Representative images (a) and quantification (c) of smRNA FISH for EZH2 and TBP coupled with MAP2 immunocytochemistry in the newly born neurons derived from hPSC and mEpiSC at d23 and d9 respectively. (b) depicts the fraction of neurons at comparable differentiation stages in human versus mouse neurons (n = 6 FOV from 2 independent experiments). (c) depicts neurons. Human d23 n = 57, mouse d9 n = 52 (neurons from 8 FOV from 2 independent differentiations). d, RT-qPCR expression of neuronal maturation markers upon treatment of mEpiSC-derived NPC with GSK343 and DMSO. d6 n = 5; d8 n = 5; d9 n = 4; d10 n = 5; d11 n = 4; d12 n = 5; d14 n = 5 (DMSO), n = 4 (Ezh2i); d16 n = 2 (DMSO), n = 3 (Ezh2i); d18 n = 2; d20 n = 3(independent experiments). e, RT-qPCR expression of maturation markers in mEpiSC-derived neurons at d12 upon different treatment durations with GSK343 and DMSO (n = 3 independent experiments). f, Representative images (left) and quantification (right) of the fraction of c-Fos+/Tbr1+ mEpiSC-derived neurons at d12 upon different durations of treatment with GSK343 and DMSO (n = 3 independent experiments). g, Representative images (top) and quantification (bottom) of the mean intensity of H3K27me3 staining in MAP2+ mEpiSC-derived neurons at d12. n = 30 neurons from 2 independent experiments. h, Representative images (top) and quantification (bottom) of the fraction of c-Fos+/Tbr1+ mEpiSC-derived neurons at d12 upon treatment with Ezh2i, DMSO and JMJD3i/Utxi. DMSO and JMJD3i/Utxi n = 3, EZH2i+ n = 2 (independent experiments). Ezh2i: 4uM GSK343 d4-6. Ezh2i +: 4uM GSK343 d4-6 plus 2uM GSK343 d6-10. JMJD3i/Utxi: 1uM GSK J4 d4−6. Histograms depict mean ± s.e.m. Two-tailed Welch’s test (c); ordinary one-way ANOVA with Holm-Šídák’s correction (e, f, h); Kruskal-Wallis test with Dunn’s correction (g). Scale bars are 100 μm (f, h); 50 μm (g); 10 μm (insets in g). FOV, field of view.

