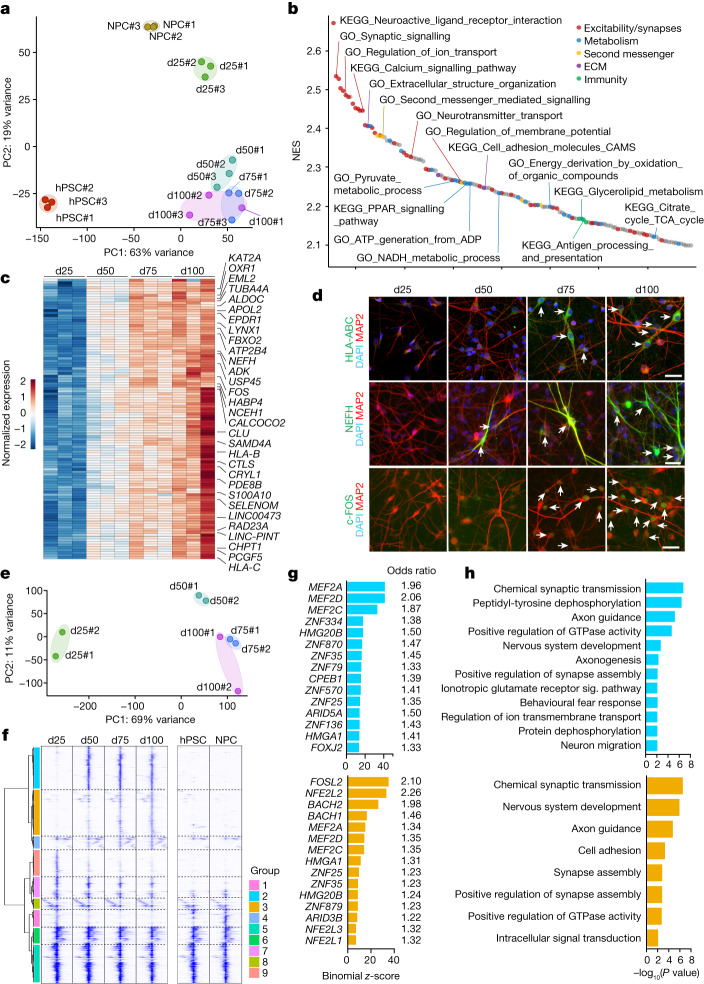
Fig. 2. Molecular staging of neuronal maturation.
a, PCA plot of RNA-seq datasets show distribution of samples according to their time of differentiation based on top 1000 differentially expressed transcripts with variance stabilized normalization. b, Waterfall plot of top 150 pathways that are enriched in more mature neurons by GSEA in d50 versus d25 comparison. NES, normalized enrichment score. c, Heat map for the normalized temporal expression of strict monotonically upregulated transcripts (maximum log fold change (FC) >1 at any comparison, expression > 5 reads per kilobase per million mapped reads (RPKM) at any timepoint, s.e.m. at d100 < 1). d, Representative images of neurons at indicated timepoints, stained with antibodies for indicated maturation markers. e, PCA plot of ATAC-seq dataset shows distribution of samples according to their maturation stage. f, Agglomerative hierarchical clustering by Ward linkage of differentially accessible ATAC-seq peaks in neurons identifies nine groups of peaks with stage-specific accessibility. g, Top 15 enriched transcription factor binding motifs at late-opening ATAC-seq peaks by the hypergeometric test (top, group 2; bottom, group 3). Odds ratio indicates the normalized enrichment of transcription factor motifs in the cluster compared to the background. h, GO term analysis for genes linked at late-opening ATAC-seq group 2 (top) and 3 (bottom) peaks show enrichment for synaptic-related pathways. Fisher’s Exact test with Benjamini correction. Sig., signalling. RNA-seq and downstream analyses: n = 3 independent experiments; ATAC-seq and downstream analyses: n = 2 independent experiments.

