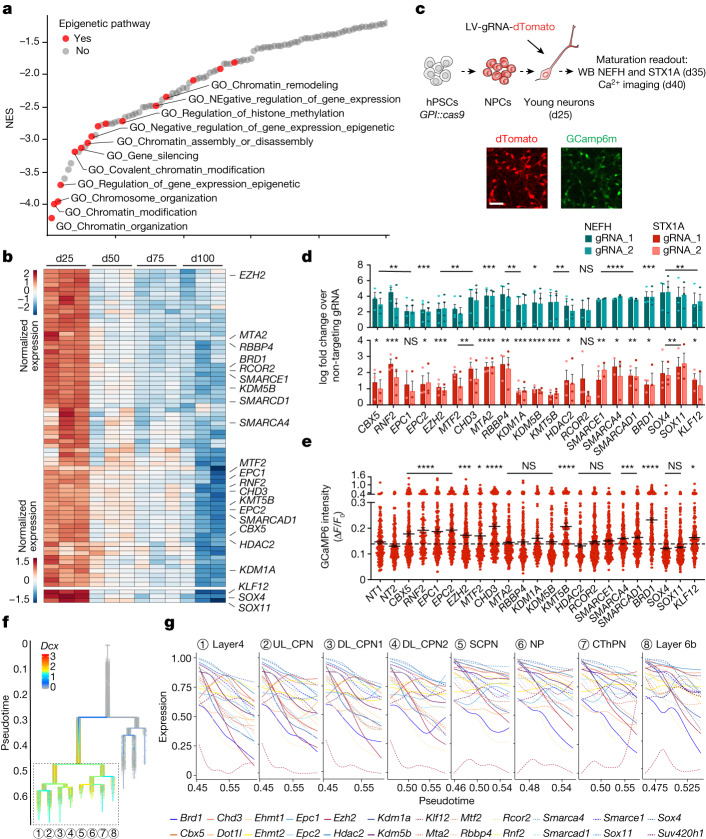
Fig. 3. An epigenetic switch drives neuronal maturation.
a, Waterfall plot of the top 100 pathways that are negatively correlated with neuronal maturation by GSEA in d50 versus d25 comparison of RNA-seq samples. n = 3 independent experiments. Red dots indicate epigenetic pathways. b, Heat map for normalized expression of monotonically downregulated chromatin regulators during maturation (with maximum logFC > 1 at any comparison). Top, epigenetic factors; bottom, transcription factors. n = 3 independent experiments. Labelled genes were selected for gene knockout studies. c, Experimental paradigm for gene knockout in cortical neurons derived from hPSCs: Cas9 expressing neurons at d25 were infected with lentiviruses encoding gene-specific gRNAs. Induction of precocious maturation was assessed by western blot (WB) at d35 and Ca2+ imaging at d40. Scale bar, 50 μm. d, Normalized expression by western blot of the maturation markers NEFH and STX1A upon gene knockout in neurons (two gRNAs per gene). Histograms depict average log2FC ± s.e.m. over non-targeting gRNA samples. Dots represent independent experiments. e, Amplitude of spontaneous Ca2+ spikes of individual neurons upon gene knockout. The dotted line represents the average amplitude for the two non-targeting gRNA. Dots represent individual neurons from two independent experiments. f, Branching lineage tree from scRNA-seq data of mouse development (Di Bella et al.41) showing Dcx expression. g, Temporal expression of mouse chromatin regulator genes homologous to the human genes that are perturbed in hPSC-derived neurons (d) across multiple neuron subtypes in the mouse neocortex. UP, upper layer; DL, lower layer; CPN, callosal projection neurons; SCPN, subcerebral projection neurons; NP, near projecting; CThPN, cortico-thalamic projection neurons. ****P < 0.0001, ***P < 0.001, **P < 0.01, *P < 0.05. NS, not significant. n and P values in d and e are reported in Supplementary Tables 2 and 3. Two-tailed one sample t-test (d); Welch’s one-way ANOVA with Games–Howell’s multiple comparisons test (e).

