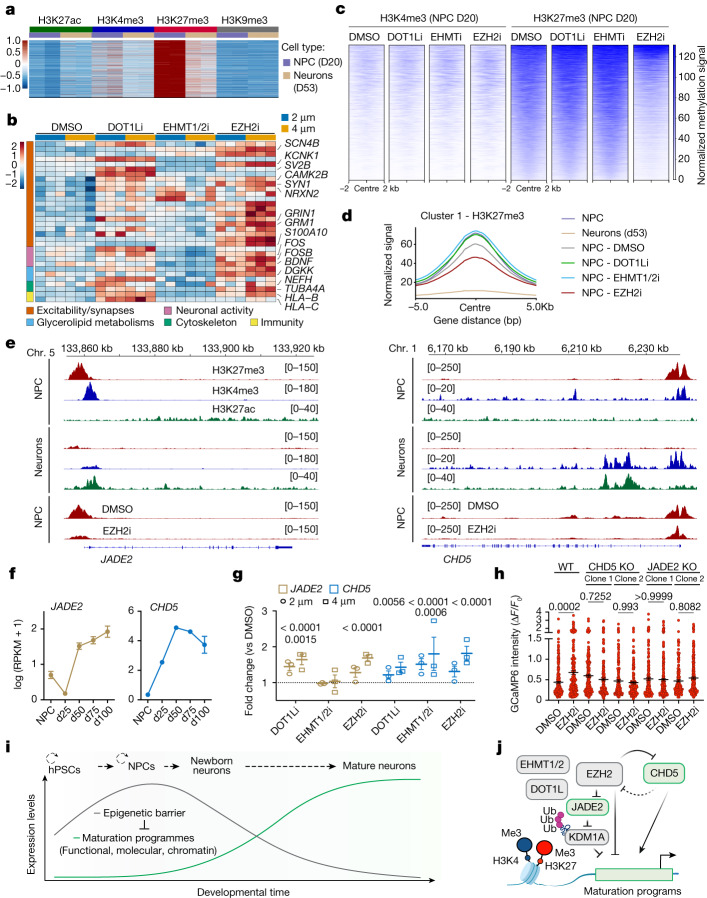
Fig. 5. An epigenetic barrier in NPCs controls the onset of neuron maturation programmes.
a, Heat map for cleavage under targets and release using nuclease (CUT&RUN) peaks with bivalent status in NPCs that get resolved towards active chromatin via H3K27me3 reduction in neurons (n = 2 independent experiments). Data are normalized signal from cluster 1 from CUT&RUN in Extended Data Fig. 10. b, Heat map for the normalized expression of representative bivalent genes by RNA-seq of d38 neurons derived from treated NPCs (2 and 4 μM) (n = 3 independent experiments). c, Tornado plots for the normalized H3K4me3 and H3K27me3 signals at bivalent peaks in NPCs upon epigenetic inhibition (n = 2 replicates per condition). d, Normalized H3K27me3 signal at bivalent peaks in NPCs upon epigenetic inhibition, untreated NPC and neurons. e, Representative tracks of H3K27me3, H3K4me3 and H3K27ac (untreated NPCs and neurons) and H3K27me3 (NPCs upon EZH2i and DMSO treatments) at CHD5 and JADE2 genomic loci. f,g, CHD5 and JADE2 expression by RNA-seq during maturation (f) and in d38 neurons derived from NPC upon epigenetic inhibition versus DMSO (2 and 4 μM) (g). n = 3 independent experiments. h, Amplitude of spontaneous Ca2+ spikes in neurons from EZH2i versus DMSO conditions derived from wild-type (WT), CHD5-knockout (KO) and JADE2-KO hPSC lines. DMSO: WT, n = 241; CHD5-KO clone 1, n = 184; CHD5-KO clone 2, n = 165; JADE2-KO clone 1, n = 183; JADE2-KO clone 2, n = 171 JADE2-KO clone 1,. EZH2i: WT, n = 190; CHD5-KO clone 1, n = 197; CHD5-KO clone 2, n = 147; JADE2-KO clone 1, n = 222; JADE2-KO clone 2, n = 213 (neurons from 2 independent experiments). i,j, Main conclusions of the study. i, The gradual unfolding of maturation signatures in hPSC-derived neurons is marked by the retention of an epigenetic barrier established at NPC stage. j, Key members of the epigenetic barrier maintain maturation programmes in a poised state through the deposition of repressive histone marks. Ub, ubiquitin. Data are mean ± s.e.m. Wald’s test with Benjamini–Hochberg correction (g); Welch’s one-way ANOVA with Games–Howell’s correction (h).

