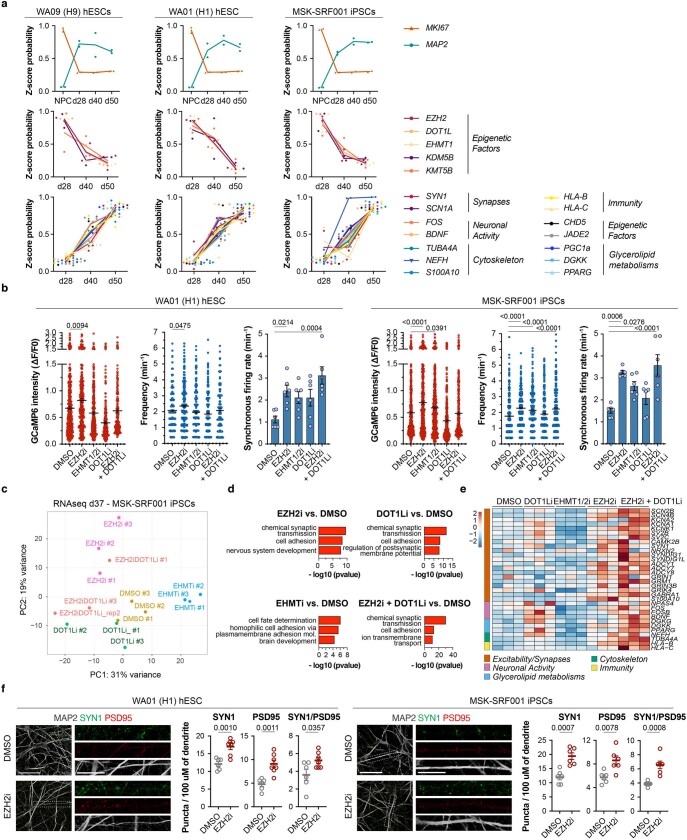
Extended Data Fig. 2. Validation of maturation signatures and paradigms of epigenetic inhibition in neurons derived from additional hPSC and iPSC lines.
a, RT-qPCR expression analysis of NPC and neuron markers (top), selected epigenetic factors (middle) and maturation markers capturing several maturation phenotypes (bottom), upon synchronized differentiation of WA09 and WA01 hPSC and MSK-SRF001 iPSC. Data are represented as z-score normalized expression (n = 2 independent experiments per cell line). b, Quantification of amplitude and frequency of spontaneous Ca2+ spikes and synchronous firing rate in neurons derived from treated versus DMSO control NPCs of WA01 hESC and MSK-SRF001 iPSC. Amplitude and frequency, WA01: DMSO n = 352, EZH2i n = 313, EHMT1/2i n = 324, DOT1Li n = 310, EZH2i + DOT1Li n = 184; MSK-SRF001: DMSO n = 423, EZH2i n = 372, EHMT1/2i n = 485, DOT1Li n = 362, EZH2i + DOT1Li n = 315 (neurons from 2 independent experiments). Synchronous firing rate (n = 6 FOV from 2 independent experiments). c–e, RNA-seq studies in d37 neurons derived from MSK-SRF001 iPSC upon NPC treatments versus DMSO control conditions. PCA plot for RNA-seq datasets show samples distribution according to treatments (c). GO for upregulated transcripts (d). Heatmap for the normalized expression of representative transcripts within selected bivalent genes in treated and control conditions (e). n = 3 independent experiments. f, Representative images and quantification of the number of SYN1 and PSD95 synaptic puncta in d65 neurons derived from EZH2i versus DMSO conditions from WA01 and MSK-SRF001 lines (n = 6 FOV from 2 independent experiments per each line). Data is mean ± s.e.m. Welch’s one-way ANOVA with Games-Howell’s multiple comparisons test (amplitude and frequency in b); ordinary one-way ANOVA with Dunnett correction (synchronicity in b); Fisher’s Exact test (d); two-tailed unpaired t-test (f). Scale bars in (f) are 50 μm and 25 μm (insets). FOV, field of view.

