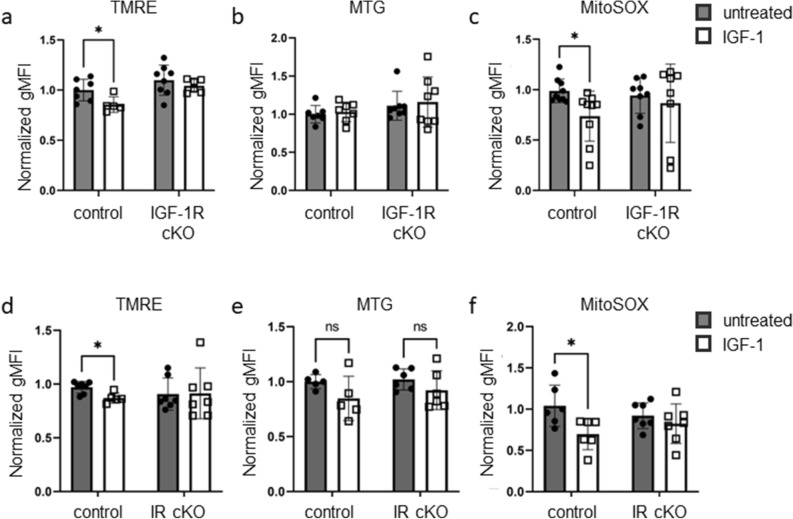
Figure 5.
IGF-1 treatment of Th17 cells decreases mitochondrial membrane potential and mROS production in an IGF-1R and IR dependent manner. (a–c) CD4+ T cells were isolated from IGF-1R cKO mice and littermate controls and differentiated in vitro to Th17 cells in media supplemented with Insulin Free Media Supplement, then treated with or without IGF-1 (50 ng/mL) for an additional 48 h. Mitochondrial membrane potential measured by TMRE staining; normalized geometric mean fluorescence intensity shown (a). Mitochondrial mass measured by MTG staining; normalized geometric mean fluorescence intensity shown (b). mROS measured by MitoSOX staining; normalized geometric mean fluorescence intensity shown (c). (d–f) CD4+ T cells were isolated from IR cKO mice and littermate controls and differentiated in vitro to Th17 cells in media supplemented with Insulin Free Media Supplement, then treated with or without IGF-1 (50 ng/mL) for an additional 48 h. Mitochondrial membrane potential measured by TMRE staining; normalized geometric mean fluorescence intensity shown (d). Mitochondrial mass measured by MTG staining; normalized geometric mean fluorescence intensity shown (e). mROS measured by MitoSOX staining; normalized geometric mean fluorescence intensity shown (f). Data combined from three independent experiments. (a–c) n = 5–8 mice per group (d–f) n = 5–7 mice per group. Data analyzed using student’s t-test (*p < 0.05).

