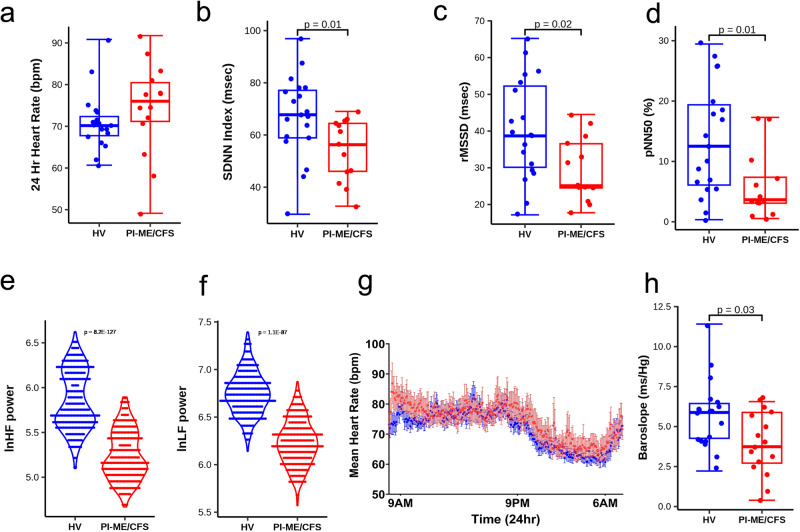
Fig. 2. Diminished heart rate variability measures are consistent with decreased parasympathetic activity in the PI-ME/CFS cohort compared to HV.
a Table of time and frequency domain heart rate variability measurements. Group comparisons for panel a were performed with unadjusted two-sided Mann–Whitney U tests. Box plots comparing HV (blue; n = 19 independent participants) and PI-ME/CFS (red; n = 14 independent participants) for (b) SDNNI (msec) (c) rMSSD (msec, p = 0.019, unadjusted two-sided t-test for independent samples with equal variance) (d) pNN50 (%, p = 0.017, unadjusted two-sided Mann–Whitney U test) (e) lnHF(ms2) (f) lnLF (ms2). Box plots depict the median (horizontal line) within quartiles 1–3 (bounds of box). Whiskers extend to minimum and maximum values g: Mean heart rate of HV (blue; n = 20 independent participants) and PI-ME/CFS (red; n = 13 independent participants) of 5-min segmented intervals over a 24-h period graphed over 24-h period. Error bars represent ±SE for each 5-min time block for each group. Note HV graph (blue) demonstrates fluctuations throughout the day with subject heart rates displaced slightly higher, suggesting increased sympathetic activity. Similarly, the typical sinusoidal drop in heart rate over sleeping hours is diminished in subjects also suggesting diminished parasympathetic and/or increased sympathetic activity. h Box plot of baroreflex-cardiovagal gain as measured by mean baroslope (ms/mmHg). HVs (blue; n = 19 independent participants) and PI-ME/CFS (red; n = 16 independent participants) are compared using an unadjusted two-sided t-test for independent samples with equal variance (p = 0.015). Box plot H depicts the median (horizontal line) within quartiles 1–3 (bounds of box). Whiskers extend to minimum and maximum values. SDNNi standard deviation of the average NN intervals for each 5 min segment of a 24 h HRV recording, rMSSD root mean square of successive differences between normal heartbeats, pNN50 proportion of NN50 divided by the total number of NN (R-R) intervals, HF high frequency, LF low frequency, SD1 standard deviation of Poincaré plot of RR intervals perpendicular to the line-of-identity, SD2 standard deviation of the Poincaré plot of RR intervals along the line-of-identity. Source data are provided as a Source Data file.

