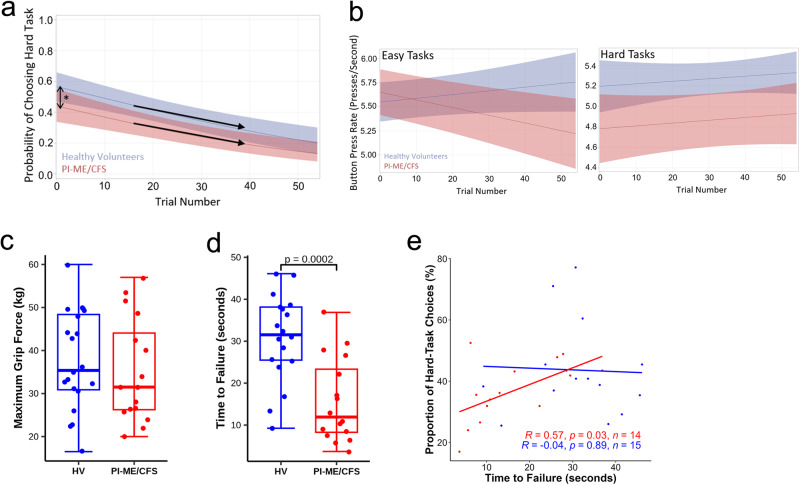
Fig. 3. Impaired effort measures and motor performance were observed in PI-ME/CFS cohort compared to HV.
a, b Effort-Expenditure for Rewards Task: a Probability of choosing the hard task is significantly more in HV (blue, n = 16 independent participants) compared with PI-ME/CFS (red; n = 15 independent participants) at the start of and throughout the task. The Odds Ratio for the probability of choosing the hard task at the start of the task is 1.65 [1.03, 2.65], p = 0.04 using Fisher’s Exact test. The lines are the curvilinear fits and the error bands are the confidence intervals. Decline rates (i.e. response to fatigue) between the groups is similar as the trial progresses. b Button press rates for easy (right) and hard (left) tasks as the trial progresses is shown for HV (blue) and PI-ME/CFS (red) participants. The lines are the linear fits and the shaded error bands are the confidence intervals. The decline in button press rate over time during the easy tasks in PI-ME/CFS did not impact easy task performance, which is supportive of pacing in PI-ME/CFS participants. c–e Grip Strength test: Box plots of (c) maximum grip force of HV (blue; n = 20 independent participants) and PI-ME/CFS (red; n = 16 independent participants) and (d) time to failure of HV (blue; n = 18 independent participants) and PI-ME/CFS (red; n = 16 independent participants), unadjusted two-sided t-test for independent samples with equal variance, p = 0.0002. Correlation between time to failure and (e) proportion of hard task choices in HV (blue; n = 15 independent participants) and PI-ME/CFS (red; n = 14 independent participants). For figure e, the relationship between indicated variables in x and y axis were fitted by linear regression in each group. Linear regression t-tests were used to determine non-zero slope. Exact p values of the correlations are presented on the graph. For box plots c and d, boxes depict the median (horizontal line) within quartiles 1–3 (bounds of box). Whiskers extend to minimum and maximum values. Source data are provided as a Source Data file.

