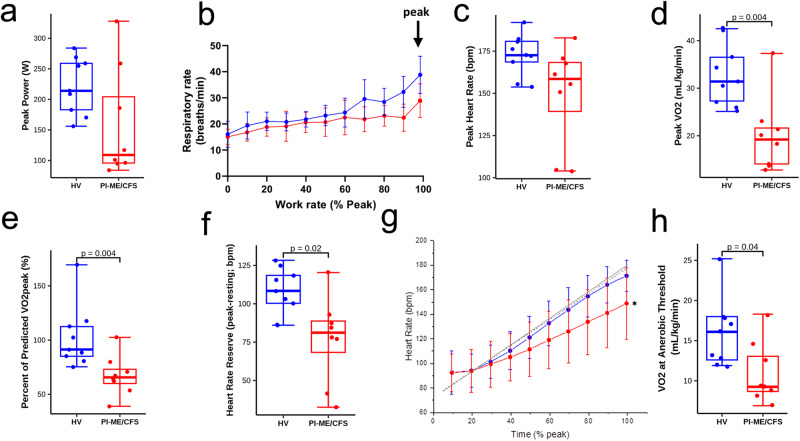
Fig. 5. Impaired cardiopulmonary performance was observed in PI-ME/CFS cohort compared to HV.
Cardiopulmonary Exercise Test (CPET) a–h: Box plots of (a) peak power attained during CPET for HV (blue; n = 9 independent participants) and PI-ME/CFS (red; n = 8 independent participants) participants, (b) peak respiratory rate with the error bars representing ±SD at each work rate, (c) peak heart rate (unadjusted two-sided t-test for independent samples with unequal variance, p = 0.072), (d) Peak VO2 (unadjusted two-sided t-test with equal variance, p = 0.002), (e) Percent of predicted VO2 achieved of HV (blue; n = 9 independent participants) and PI-ME/CFS (red; n = 8 independent participants) participants (unadjusted two-sided t-test for independent samples with equal variance, p = 0.004), and (f) heart rate reserve for HV (blue; n = 9 independent participants) and PI-ME/CFS (red; n = 8 independent participants) participants (unadjusted two-sided t-test for independent samples with equal variance, p = 0.011). g Heart rate as a function of % total CPET time depicted as expected for age and gender of HV (n = 9 independent participants) and PI-ME/CFS (n = 8 independent participants) (gray solid and dashed lines, respectively, unadjusted two-sided Mann–Whitney U test for independent samples). Mean heart rate responses from the CPET are depicted for HV (blue line) and PI-ME/CFS (red line). A significant difference was observed for the heart rate slope between PI-ME/CFS and expected (0.70 ± 0.27 versus 1.05 ± 0.12, p = 0.014), but not for HV and expected (1.03 ± 0.16 versus 1.08 ± 0.13; p = 0.479). The deviation from expected relation reflects chronotropic incompetence in the PI-ME/CFS group. h Box plot of VO2 at the anaerobic threshold (AT) in HV (blue; n = 9 independent participants) and PI-ME/CFS (red; n = 8 independent participants) using an unadjusted two-sided t-test for independent samples with equal variance (p = 0.024). For box plots a, c–f, and h boxes depict the median (horizontal line) within quartiles 1–3 (bounds of box). Whiskers extend to minimum and maximum values. Source data are provided as a Source Data file.

