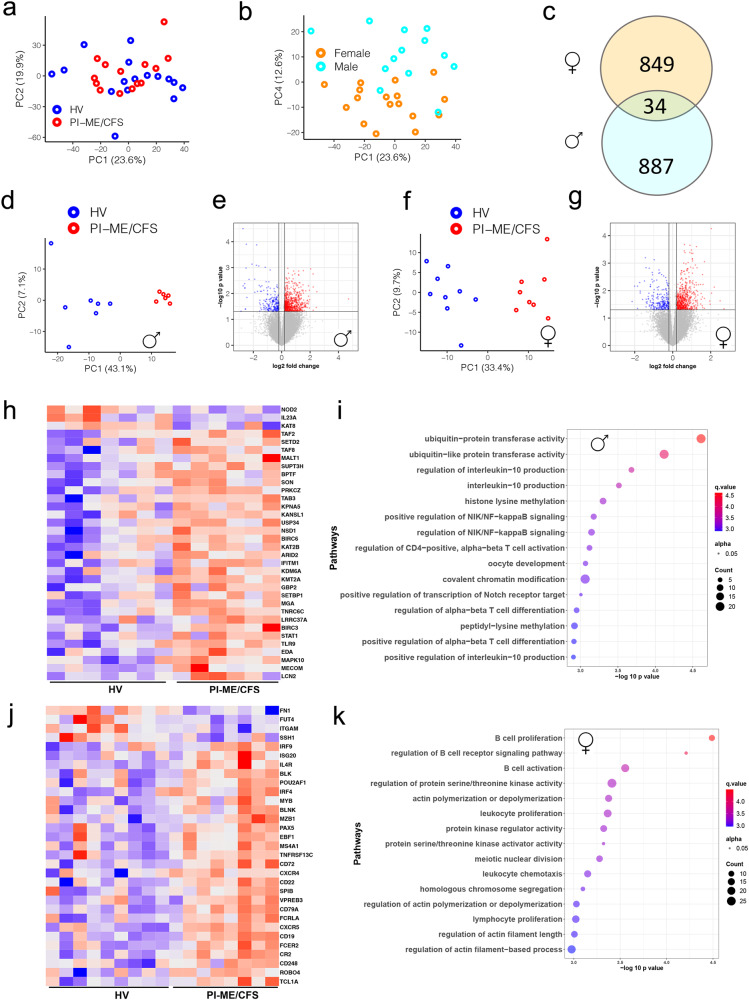
Fig. 8. Male and female cohorts have distinct perturbation in immune cell subpopulation and biological processes in PBMCs.
a, b PCA computed from all gene expression values with indicated groups: HV (blue), PI-ME/CFS (red) clusters or males (turquoise) and females (orange) highlighted for the indicated PCs. c Venn diagram showing common DE genes identified from male and female cohorts (p value < 0.05 as filter for DE genes using an unadjusted two-sided moderated t-test). DE analysis on the (d, e, h, i) male cohorts and (f, g, j, k) female cohorts. d, f PCA plots computed from DE genes shows robust clustering of samples based on the PI-ME/CFS status. e, g Volcano plots shows log transformed statistically significant (unadjusted p-values < 0.05 using an unadjusted two-sided moderated t-test) up (red) and down regulated (blue) genes in PI-ME/CFS male and female cohorts, respectively. h, j Heatmaps of a subset of T cell process genes in males and B cell related processes in females. i, k Pathway enrichment plots showing top 15 pathways for which the DE genes from male and female cohorts selected for. The top 15 pathways are labeled on the y axis and the color of the circle is scaled with –log-10 p-value and the size of the pathway circles inside the plot are proportional to the number of genes that overlapped with the indicated pathway. Fisher’s exact test was used in the ‘clusterProfiler’ R package to obtain the log-transformed p-values. Red color nodes: upregulated in PI-ME/CFS and blue color nodes: downregulated in PI-ME/CFS. DE differentially expressed. Source data are provided as a Source Data file.

