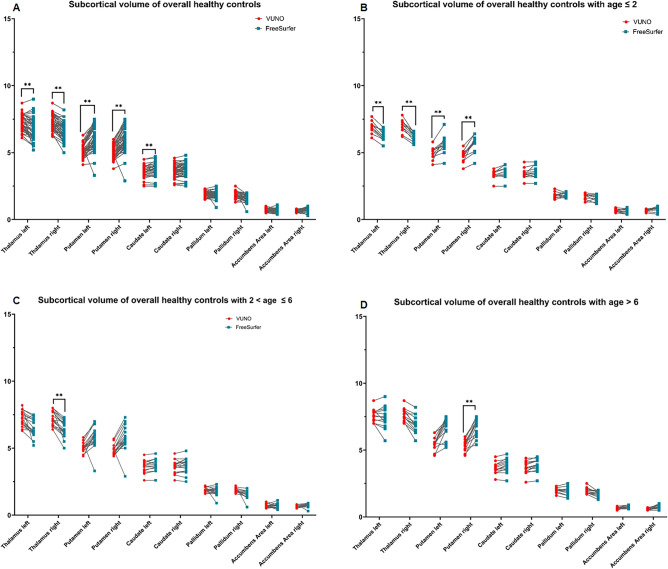
Figure 2.
Subcortical volume analysis in a 42 healthy control by the DLS method and Freesurfer with manual correction. (A) Whole brain volume of overall healthy controls (B) Whole brain volume of healthy controls with age ≤ 2 years (C) Whole brain volume of healthy controls with 2 < age ≤ 6 (D) Whole brain volume of healthy controls with age > 6 The blue dots showed the volume measured by Freesurfer with manual correction; The red dots showed the volume measured by the DLS method. **p-values < 0.001.

