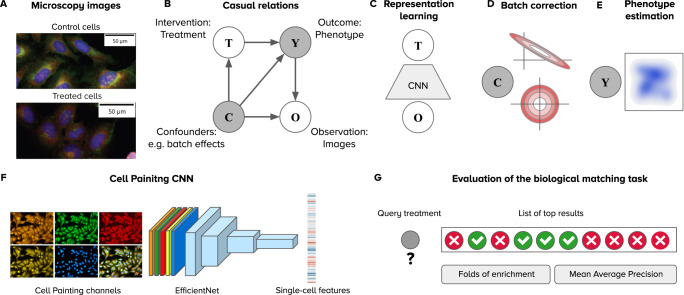
Fig. 1. Framework for analyzing image-based profiling experiments.
A Example Cell Painting images from the BBBC037 dataset of control cells (empty status) and one experimental intervention (JUN wild-type overexpression) in the U2OS cell line. B Causal graph of a conventional high-throughput Cell Painting experiment with two observables in white circles (treatments and images) and two latent variables in shaded circles (phenotypes and batch effects). The arrows indicate the direction of causation. C Weakly supervised learning as a strategy to model associations between images (O) and treatments (T) using a convolutional neural network (CNN). The CNN captures information about the latent variables C and Y in the causal graph because both are intermediate nodes in the paths connecting images and treatments. D Illustration of the sphering batch-correction method where control samples are a model of unwanted variation (top). After sphering, the biases of unwanted variation in control samples is reduced (bottom). E The goal of image-based profiling is to recover the outcome of treatments by estimating a representation of the resulting phenotype, free from unwanted confounding effects. F Illustration of the Cell Painting CNN, an EfficientNet model trained to extract features from single cells. G The evaluation of performance is based on nearest neighbor queries performed in the space of phenotype representations to match treatments with the same phenotypic outcome. Performance is measured with two metrics: folds of enrichment and mean average precision (Methods).

