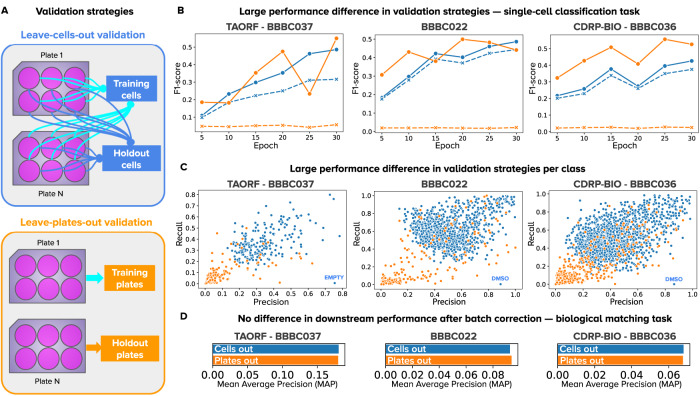
Fig. 2. Validation strategies for the single-cell classification task in weakly supervised learning.
A Illustration of the two strategies: leave-cells-out (in blue) uses cells from all plates in the dataset for training and leaves a random fraction out for validation. Leave-plates-out (in orange) uses all the cells from certain plates for training, and leaves entire plates out for validation. Any difference in performance is due to confounding factors. Note that plates-left out are selected such that all treatments have two full replicate-wells out for validation, which may or may not correspond to entire batches, depending on the experimental design. B Learning curves of models trained with WSL for 30 epochs with all treatments from each dataset. The x-axis is the number of epochs and the y axis is the average F1-score. The color of lines indicates the validation strategy, and the style of lines indicates training (solid) or validation (dashed) data. C Precision and recall results of each treatment in the single-cell classification task. Each point is a treatment (negative controls are labeled in blue), and the color corresponds to the validation strategy. D Performance of models in the downstream, biological matching task after batch correction. Source data is provided as a Source Data file.

