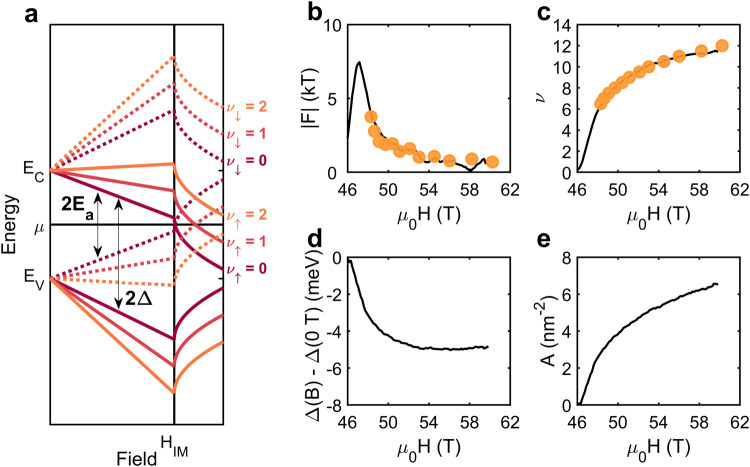
Fig. 6. Relating the quantum oscillation frequency to magnetization, hybridization gap, and Fermi surface area.
a Landau-level plot considering the combined effects of Zeeman splitting, Landau quantization, and gap reduction at high fields. Colors correspond to different Landau level indices and dashed/solid lines denote different spins. Above the insulator–metal transition, the Landau levels have a non-linear field dependence owing to the non-linear magnetization (M). b Quantum oscillation frequency (F) computed assuming the Fermi surface area is proportional to M 2/3 (black) compared to the measured quantum oscillation frequency in the metallic state (orange). From this relationship, it is possible to determine the c Landau indices (ν) of the quantum oscillations, and the field-dependence of the d gap (Δ(B)−Δ(0T)) and e Fermi surface area (A). Magnetization data is taken from ref. 19.

