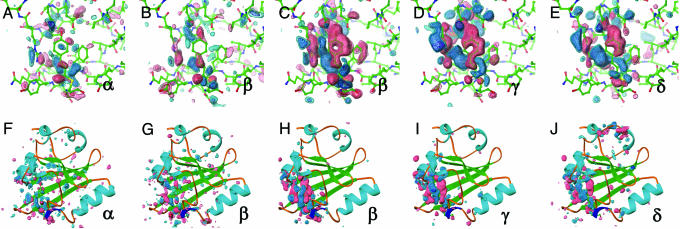
Fig. 2.
Difference electron density maps for distinct chemical states (α, β, γ, and δ) from an initial kinetic analysis of 47 time points from 1 ns to 1 s. Chromophore-binding pocket (A-E) and whole protein views (F-J) of the difference maps associated with the “α” (A and F) and “β” (B and G) states derived from the ESRF data and from the “β” (C and H), “γ” (D and I), and “δ” (E and J) states from the APS data. Difference maps are contoured at -4σ (red), -3σ (pink), +3σ (cyan), and +4σ (blue). These chemical states are in the order of occurrence in time through the photocycle of PYP. The population of the α, β, γ, and δ states are peaked around at nanoseconds, microseconds, milliseconds, and subseconds time range, respectively (see text and Figs. 3 and 4B).

