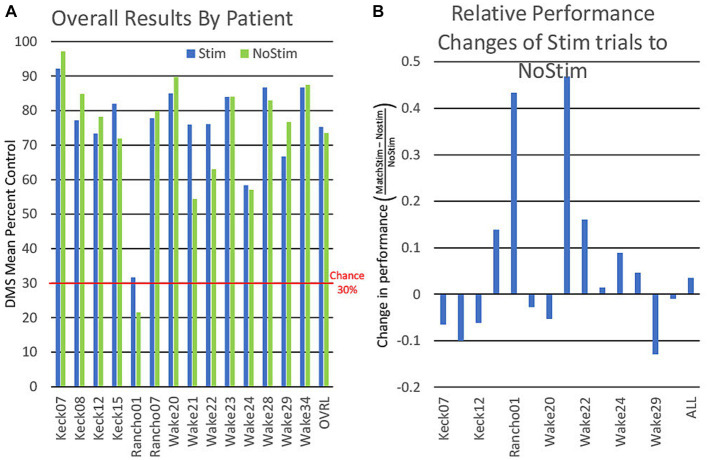
Figure 6.
(A) Graph of individual patient performance on stimulated and non stimulated trials. DMS performance is for all trials combined and is not an average of performance within categories. (B) Graph showing the relative differences of patient performance between stimulated and non stimulated trials using non stimulated trials as a baseline.

