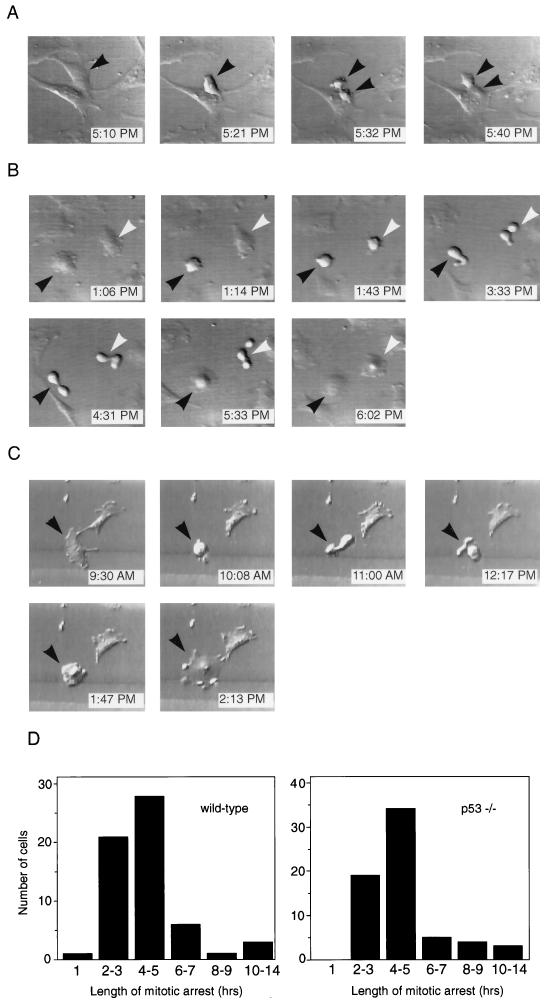
FIG. 2.
Time-lapse videomicroscopy of wild-type and p53−/− MEFs at mitosis in the presence or absence of nocodazole. (A) Control p53−/− MEF that underwent mitosis in normal media. Each photograph lists the time when the video recording occurred. The cell entered mitosis at 5:21 PM (arrowhead), cytokinesed at 5:32 PM (two arrowheads), and completed division by 5:40 PM. The cell shown is representative of over 30 cells (wild-type and p53−/−) observed undergoing normal mitosis. (B) Two wild-type MEFs that initiated mitosis in the presence of nocodazole. Each cell entered mitosis (1:14 PM and 1:43 PM), remained arrested at mitosis for several hours (3:33 PM and 4:31 PM), and then adapted (5:33 PM and 6:02 PM). Black and white arrowheads indicate the two different cells. (C) p53−/− MEF that entered mitosis in the presence of nocodazole (10:08 AM, arrowhead). It arrested at mitosis for several hours (11:00 AM and 12:17 PM) and eventually adapted (1:47 PM and 2:13 PM). (D) Quantitation of length of time that individual wild-type and p53−/− MEFs spent at mitotic arrest. Length of mitotic arrest was determined morphologically by time-lapse videomicroscopy, beginning when a cell first became rounded and refractile and ending when it flattened back onto the coverslip. Wild-type MEFs spent an average of 4.4 ± 2.4 h at mitotic arrest, while p53−/− MEFs spent an average of 4.6 ± 2.2 h at mitotic arrest. At least 60 cells were observed for each genotype.

