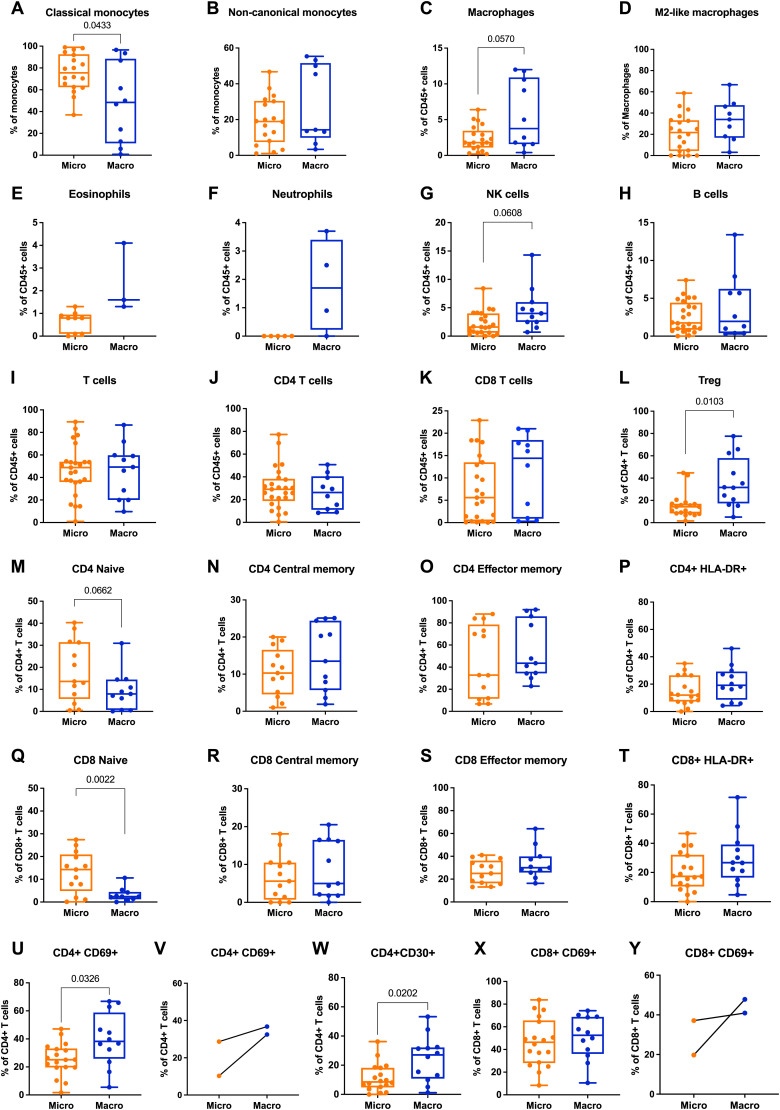
Figure 1. Flow cytometry analysis of periprosthetic leukocytes from patients with microtextured and macrotextured breast prostheses.
Frequencies of the different immune subsets calculated as (A, B) frequency of viable monocytes, (C, E, F, G, H, I, J, K) frequency of viable CD45+ cells, (D) frequency of viable macrophages, (L, M, N, O, P, U, V, W) frequency of viable CD4+ T cells, (Q, R, S, T, X, Y) frequency of viable CD8+ T cells. Each histogram in the figure represents the mean ± SD of the measured parameters. The statistical significance of differences between microtextured and macrotextured prostheses was determined using an unpaired t test with Welch’s correction.

