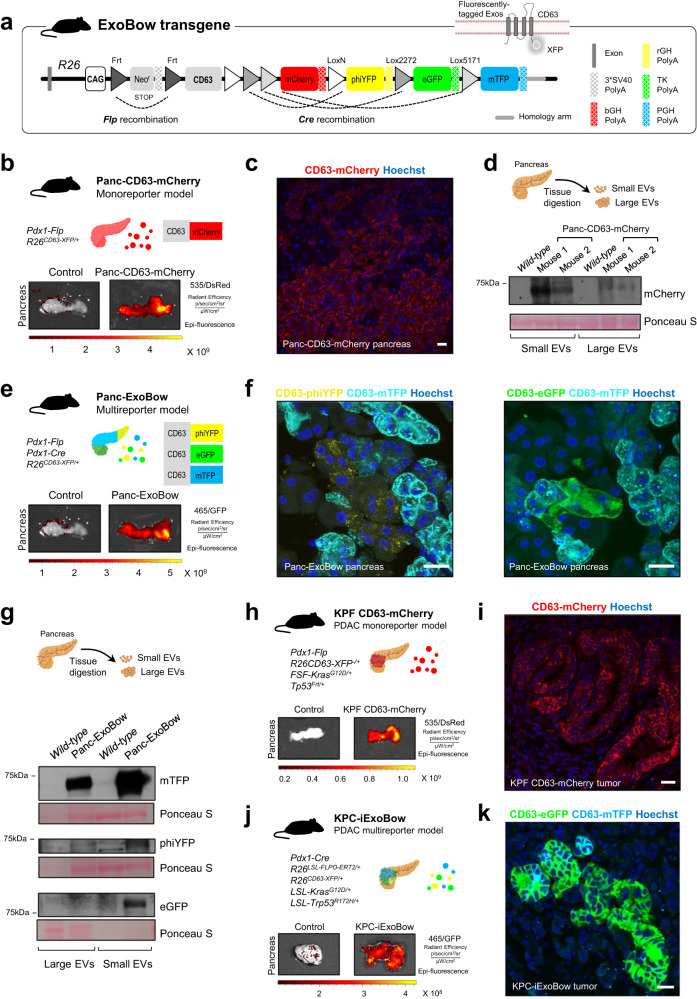
Fig. 1. The ExoBow transgene efficiently labels pancreas cells and its derived exosomes.
a The ExoBow construct is inserted in the intron one of ROSA 26 (R26) locus and is under the action of a strong synthetic promotor (CAG). Upstream of the exosomal marker CD63 mouse gene there is a neomycin resistance cassette with a stop-codon flanked by Frt sites that prevents further transcription. Following CD63 there are 4 fluorescent reporters: mCherry, phiYFP, eGFP and mTFP, each with a polyA sequence. b Schematic of the monoreporter mouse model Panc-CD63-mCherry in which Pdx1 drives the expression of the Flp recombinase. Pancreas imaging using IVIS Lumina System illustrating CD63-mCherry expression (535 excitation laser and DsRed emission filter). Pancreas of control (R26CD63-XFP/+, no recombinases, left) and Panc-CD63-mCherry mice (right; experiment repeated with a total of 6 mice). c Confocal microscopy images of a maximum projection of a Panc-CD63-mCherry pancreas section depicting exocrine and endocrine CD63-mCherry positive cells. Immunofluorescence against mCherry (red; experiment repeated with a total of 3 mice). d Schematic representation of the isolation of interstitial EVs from the pancreas tissue according to Crescitelli et al.53. Anti-mCherry western-blot in small and large EVs fractions isolated from pancreas tissue of wild-type (WT, control) or Panc-CD63-mCherry mice (experiment repeated with a total of 3 mice). e Schematic representation of the multireporter mouse model, Panc-ExoBow, in which both Flp and Cre recombinases are under the control of Pdx1 promoter. Pancreas imaging using IVIS Lumina System illustrating CD63-eGFP, CD63-phiYFP, and CD63-mTFP (465 excitation laser and GFP emission filter). Pancreas of control (R26CD63-XFP/+, left) and Panc-CD63-mCherry mice (right; experiment repeated with a total of 5 mice). f Confocal images of a maximum projection of a Panc-ExoBow pancreas section depicting CD63-mTFP, CD63-phiYFP and CD63-eGFP positive cells. Immunofluorescence for mTFP (cyan), phiYFP (yellow) and eGFP (green; experiment repeated with a total of 3 mice). g Schematic representation of the isolation of interstitial EVs from the pancreas tissue according to Crescitelli et al.53. Anti-mTFP, anti-phiYFP and anti-eGFP western-blot in small and large EVs fractions isolated from pancreas tissue of WT or Panc-ExoBow mice (experiment repeated with a total of 2 mice). h Schematic representation of the PDAC monoreporter mouse model, KPF CD63-mCherry. Pancreas images of control (no ExoBow transgene, left) and KPF CD63-mCherry mice (right; experimented repeated with a total of 4 mice). i Confocal microscopy images depicting CD63-mCherry positive cancer cells in the pancreas of a KPF CD63-mCherry mouse. Immunofluorescence against mCherry (red; experiment repeated with a total of 3 mice). j Schematic representation of the PDAC multireporter mouse model, KPC-ExoBow. Pancreas images of control (no ExoBow transgene, left) and KPC-ExoBow mice (right; experiment repeated with a total of 4 mice). k Confocal microscopy images depicting CD63-mTFP and CD63-eGFP positive cells in the pancreas of a KPC-ExoBow mouse. Immunofluorescence against mTFP (cyan), and eGFP (green; experiment repeated with a total of 2 mice). Mice age in b, c, e, f is of 8 weeks, d and g between 8–1 weeks, h i 16.3 weeks, and j k 17 weeks. In western-blots Ponceau S as loading control and 25 μg of protein samples was used. In all images nuclei are counterstained with hoechst (blue) and scale bars are 20 μm. Source data are provided as a Source Data file. Schemes created with BioRender.com.

