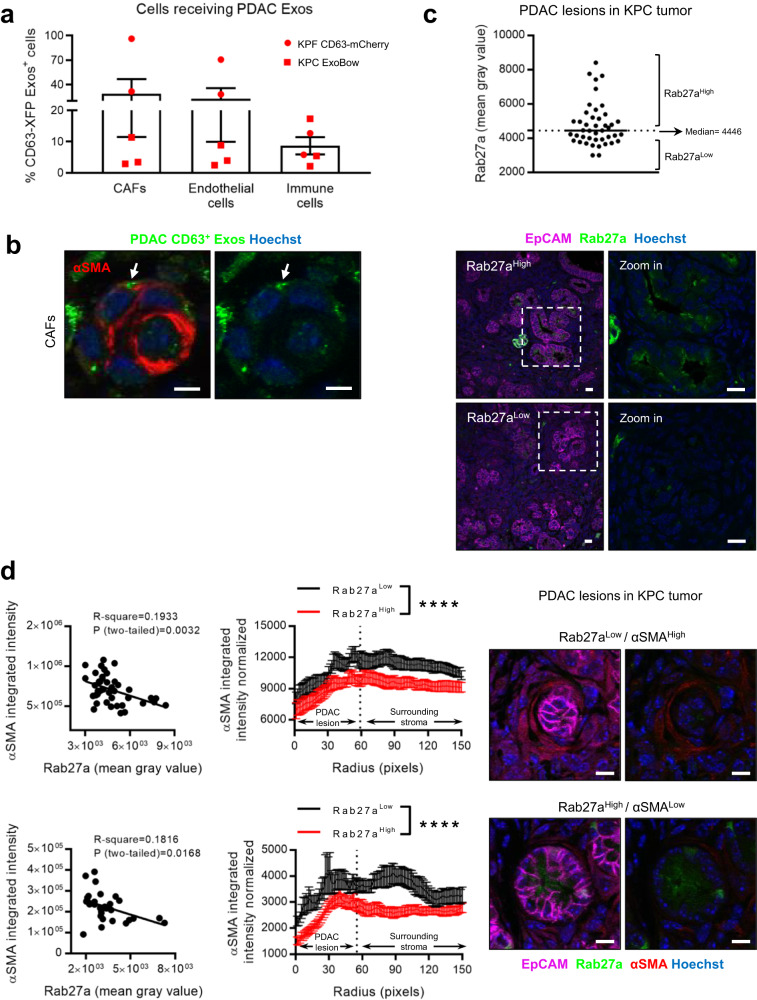
Fig. 2. Exosomes mediate intra-pancreas communication in PDAC and CAFs spatial distribution.
a Dot plot representing the percentage of cancer-associated fibroblasts (CAFs; CD140A+), endothelial cells (CD31+) and immune cells (CD45+) that received PDAC CD63+ Exos in tumors PDAC reporter mice analyzed by flow cytometry (n = 5 biologically independent animals). b Representative confocal microscopy images of PDAC Exos (green) accumulation in CAFs (alpha-smooth muscle actin –αSMA—in red). Nuclei were counterstained with hoechst (blue). Scale bar 5 μm. Experiment repeated with a total of 3 mice. c Dot plot representing the fluorescence intensity of Rab27a in different lesions (n = 43) of a KPC tumor, with representative confocal microscopy images of regions with Rab27a low or Rab27a high PDAC lesions. EpCAM (cancer cells) in magenta, Rab27a in green and nuclei were counterstained with hoechst (blue). Scale bar 20 μm. Dashed line represents the median of Rab27a intensity. d Linear regression of αSMA and Rab27a per PDAC lesion (left) and circular radial profile of the αSMA fluorescence intensity over centered Rab27a high or low PDAC lesions in two KPC tumors (upper (n = 43 PDAC lesions) and lower (n = 31 PDAC lesions) left) with representative confocal microscopy images of a Rab27aLow/αSMAHigh and Rab27aHigh/αSMALow. Rab27a in green, αSMA in red and EpCAM in magenta, nuclei were counterstained with hoechst (blue). Scale bar 10μm. Dashed lines represent the median radius fitted to the manual PDAC lesions’ ROI. Kolmogorov-Smirnov, ****p < 0.0001. Data are Mean ± SEM. Source data are provided as a Source Data file.

