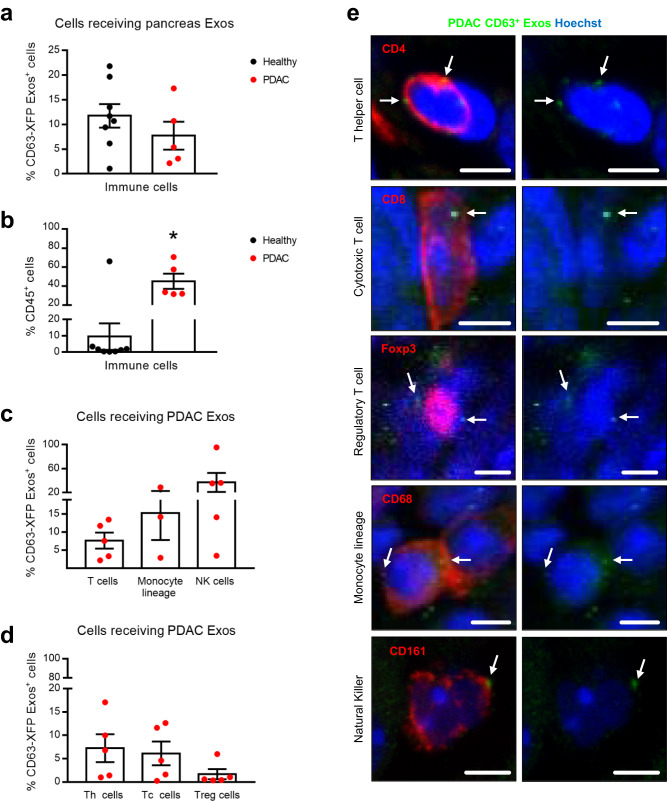
Fig. 4. PDAC exosomes mediate local communication with cells of the immune system.
a Dot plot representing the percentage of cells of the immune system (CD45+) that received pancreas-derived CD63+ Exos in health (Panc-CD63-mCherry, n = 8) and in PDAC (KPF CD63-mCherry n = 2 and KPC-ExoBow n = 3) analyzed by flow cytometry. b Dot plot representing the percentage of cells of the immune system (CD45+) in the pancreas microenvironment in health (Panc-CD63-mCherry, n = 8) and in PDAC (KPF CD63-mCherry n = 2 and KPC-ExoBow n = 3) analyzed by flow cytometry. Two-tailed Mann–Whitney test, p = 0.0186. c Dot plot representing the percentage of T cells (TCRβ+), cells of the monocyte lineage (CD11b+Ly6G/C−) and natural killer (CD11b+NK1.1+) cells that received PDAC CD63+ Exos (KPF CD63-mCherry n = 2 and KPC-ExoBow n = 3, except for monocyte-lineage n = 3 KPC-ExoBow) analyzed by flow cytometry. d Dot plot representing the percentage of T helper cells (Th, TCRβ+CD4+), cytotoxic T cells (Tc, TCRβ+CD4-), and regulatory T cells (Treg, CD4+Foxp3+) that received PDAC CD63+ Exos (KPF CD63-mCherry n = 2 and KPC-ExoBow n = 3) analyzed by flow cytometry. e Representative confocal microscopy images of PDAC CD63+ Exos (green) accumulation in different subpopulations of the tumor microenvironment (red) including T helper cells, cytotoxic T cells, and regulatory T cells, cells of the monocyte lineage and natural killer cells. Nuclei were counterstained with hoechst (blue). Scale bar 5μm. Data are Mean ± SEM. Source data are provided as a Source Data file.

