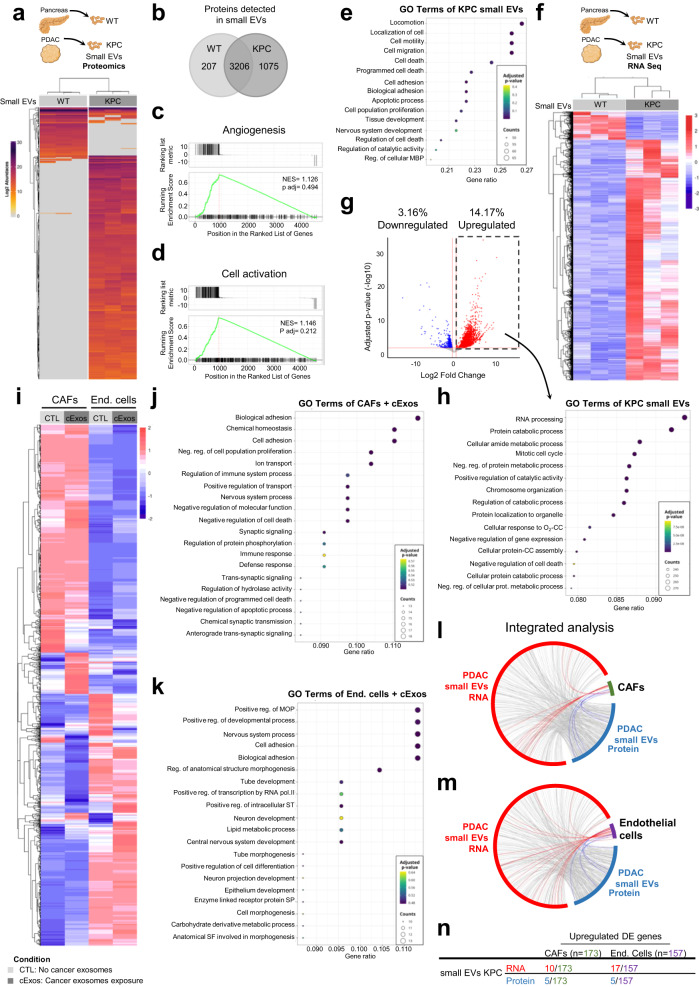
Fig. 7. EVs content reflect the local intratumor communication of PDAC.
a Schematic representation of the experimental approach for proteomics analysis (upper panel) and heatmap depicting the deferentially expressed proteins common across the 3 samples for wild-type (WT) or KPC small EVs (lower panel). Unsupervised hierarchical clustering showing separation of the two protein clusters WT and KPC small EVs. b Venn-diagram of total proteins detected in EVs from WT or KPC small EVs. Gene set enrichment analysis of the c Angiogenesis pathway that does not separate the WT from KPC small EVs, and the d Cell activation pathway which distinguishes WT from KPC small EVs. GSEA (Gene set enrichment analysis, in c and d) uses a ranked gene list, in our case, sign(fold change gene)⋅−log10(P), encompassing the differential expression between two conditions (KPC vs WT), and the Kolmogorov-Smirnov statistic to score the enrichment of a priori defined set of genes that share common biological function. Significance of the score is evaluated using an empirical permutation test correcting for multiple hypothesis testing. e Top 15 enriched reactome pathways in KPC small EVs in comparison to WT small EVs. MBP—Macromolecule Biosynthetic process. f Schematic representation of the experimental approach for proteomics analysis (upper panel) and heatmap depicting the deferentially expressed genes of WT or KPC small EVs following RNA Seq analysis (lower panel). g Volcano plot representing the downregulated and upregulated genes in KPC small EVs in comparison to WT small EVs using DESeq2. DESeq2 uses negative binomial generalized linear models for the differential analysis of count data and uses the Wald test with multiple correction (Benjamini–Hochberg method) for significance testing. Shrinkage of log2FC estimates to control for small sample sizes and low read counts was done by the apeglm method. h Top 15 enriched reactome pathways in the upregulated genes of KPC small EVs, common to KPC cell line exosomes in comparison to WT small EVs. Cellular response to oxygen-containing compound (O2-CC); Cellular protein-containing complex assembly (CC). i Heatmap depicting the Log2FoldChange > 1 in RNA Seq analysis of cancer associated fibroblasts (CAFs) or endothelial cells (bEnd.3) exposed to cancer exosomes or not (control). j Top 20 enriched reactome pathways in the upregulated genes of CAFs upon cancer exosomes exposure. k Top 20 enriched reactome pathways in the downregulated genes of bEnd.3 upon cancer exosomes exposure. MOP Multicellular Organism Process, ST Signal Transduction, SP Signaling Pathway, SF Structure Formation. Over-Representation (ORA) analysis in (e, h, j and k) employs a hypergeometric test, corrected for multitple testing using Benjamini–Hochberg method, to determine the statistical significance of the up or down-regulated DEGs in each GO term. Circos plot depicting the interaction between the KPC small EVs RNA (red) and protein (blue) cargo with the altered genes upon cancer exosomes exposure in l CAFs and m endothelial cells (bEnd.3). In all cases are represented the upregulated differentially expressed genes or proteins. n Number of entries for RNA or protein identified in KPC small EVs that are present in the upregulated differentially expressed genes of CAFs or endothelial cells exposed to cancer exosomes. Source data are provided as a Source Data file. Schemes created with BioRender.com.

