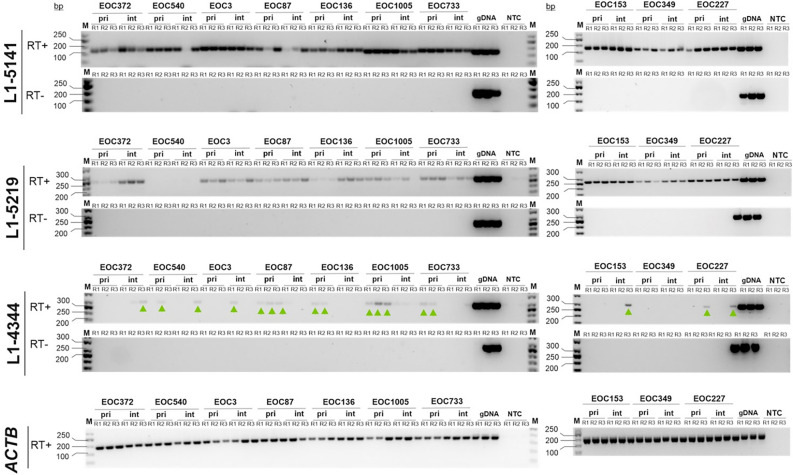
Figure 3.
Locus-specific RT-PCR detects expression of L1-5141, L1-5219 and L1-4344. Agarose gel image of L1 locus-specific RT-PCR products, assessing expression of L1-5141 and L1-5219 (detected from both bulk- and single-cell RNA-seq analysis) and L1-4344 (detected from single-cell RNA-seq analysis only). Black and white colors of the original images were inverted for ease of visualizing fainter amplification products. The presence of L1-4344 RT-PCR products (sized 291 bp) is indicated by green arrowheads. RT-PCR with primers against ACTB transcript reports on the integrity of the RNA samples. R1, R2 & R3 replicate 1, 2 & 3 respectively; p primary (pre-chemotherapy); i interval (post-chemotherapy); gDNA genomic DNA; NTC no template control; M GeneRuler 50 bp DNA ladder, Thermo Scientific).

