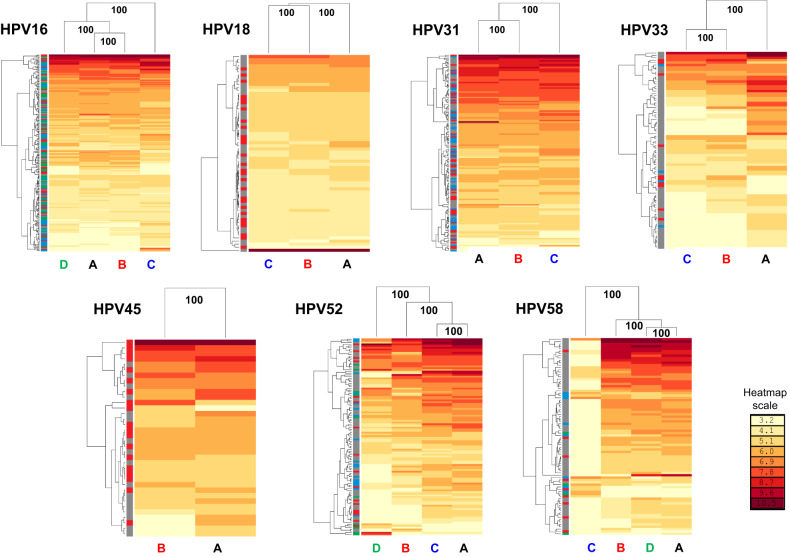
Fig. 3. Hierarchical clustering of neutralizing antibody titers.
Neutralizing antibody titers were natural log-transformed and subjected to two-dimensional hierarchical clustering with resulting data re-ordered according to serological (left) and pseudovirus antigen (top) dendrograms constructed from the resulting Euclidean distance matrices with the antigen clusters supported by the indicated percentage of 500 bootstrapped pseudoreplicates. Lineage-specific PsV antigens labeled at the base of the heatmap (A, black; B, red; C, blue; D, green). Serum sidebar denotes the natural infection lineage from which the serum (or plasma) sample is derived: A (gray), B (red), C (blue), and D (green). The antigen clusters are supported by data from many sera whereas the serum clusters are supported by data from relatively few antigens; thus, more weight should be given to the definition of antigen clusters that have bootstrap support. The indicative natural log heatmap scale bar is shown.

