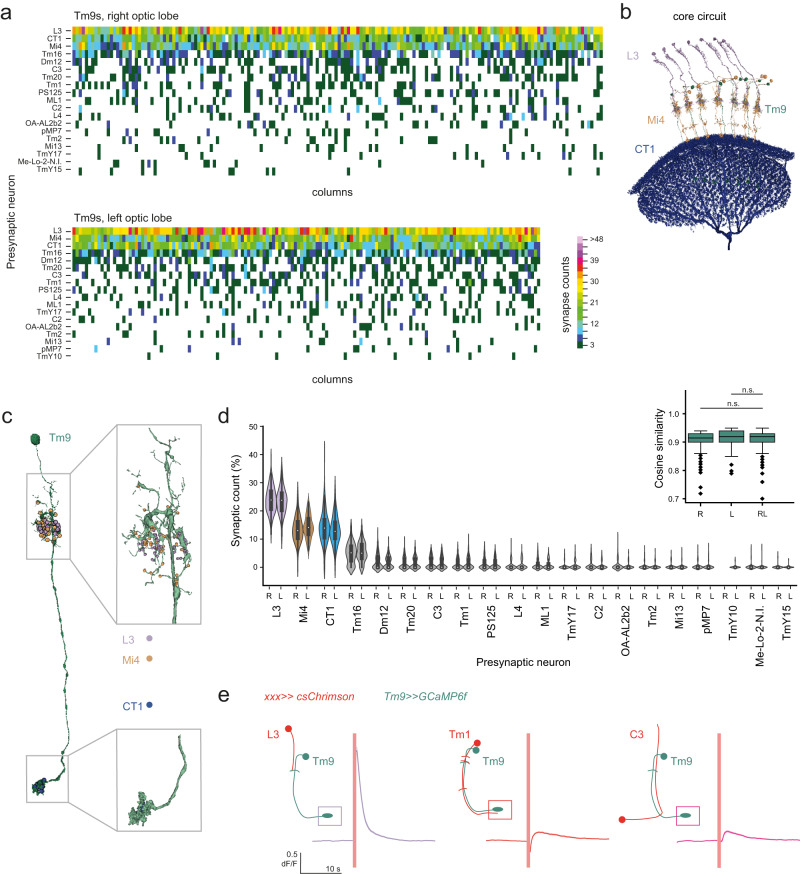
Fig. 2. Analysis of heterogeneous Tm9 inputs.
a Matrices showing synaptic counts of presynaptic inputs to Tm9 neurons of 170 columns and 150 columns of the right and left optic lobes respectively, as long as they are present in >5% of columns. b Tm9s (green) and their common presynaptic inputs L3 (purple), Mi4 (brown), and CT1 (blue). c Spatial locations of the presynapses of L3 (purple) and Mi4 (brown) on the Tm9 dendrites, and CT1 (blue) synapses on the Tm9 axon terminal. d Violin plots of the relative synaptic counts of Tm9 inputs, showing the median (white dot), the interquartile range (thick gray bar), 1.5x interquartile range (thin gray line), and outliers. Neurons with >10% contribution to synapse count are color-coded. The inset shows cosine similarity between right (R) or left (L) Tm9s and a mixed (LR) set. Box plots show the median (center line), upper and lower quartiles (box limits), the extent of the distribution (whiskers), and outliers (points). n.s. non-significant (p > 0.05), tested using a two-sided Kruskal–Wallis test, followed by pairwise comparisons with Dunn–Bonferroni correction for multiple comparisons. n = 170 columns and 150 columns of the right and left optic lobes, respectively. P values for pairwise comparisons: R-RL = 0.1829, L-RL = 0.1462. e In vivo calcium signals recorded in Tm9 neurons expressing GCaMP6f upon optogenetic activation of csChrimson expressed in L3 (n = 569 ROIs, N = 8 flies), Tm1 (n = 154 ROIs, N = 2 flies), or C3 (n = 658 ROIs, N = 8 flies), imaged in a norpA mutant background. The red line denotes the time of activation. Traces show mean ± sem.

