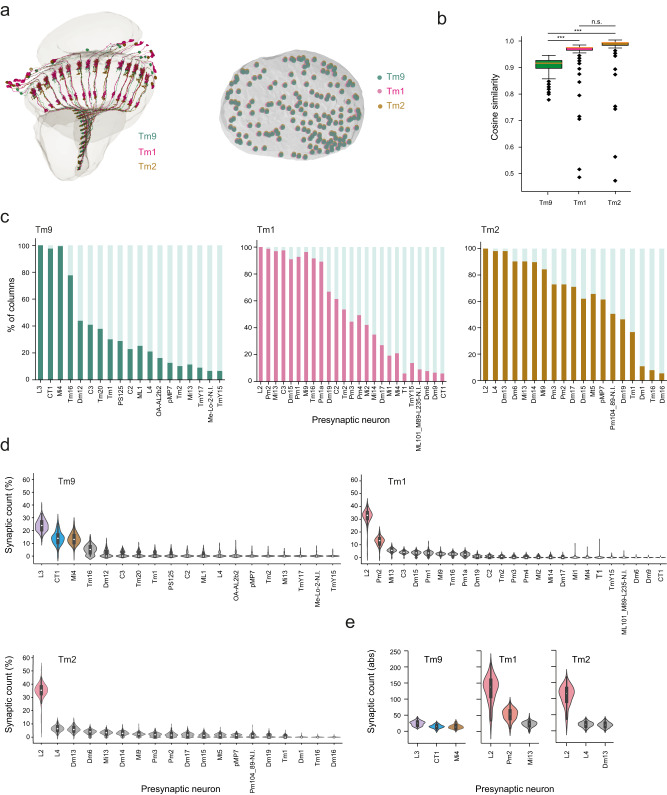
Fig. 3. Tm9 has more heterogeneous input partners than other Tm neurons.
a Left: Some example Tm9, Tm1, and Tm2 neurons from the same columns. Right: Top view of the medulla, each green/magenta/brown dot depicts one Tm9/Tm1/Tm2 analyzed. b Cosine similarity within Tm9, Tm1, or Tm2 datasets. Box plots show the median (center line), upper and lower quartiles (box limits), the extent of the distribution (whiskers), and outliers (points). Statistical testing was done using a two-sided Kruskal–Wallis test, followed by pairwise comparisons with Dunn–Bonferroni correction for multiple comparisons. ***p < 0.001, n.s. non-significant (p > 0.05). Kruskal–Wallis p value = 2.542 e-64. P values for pairwise comparisons: Tm9-Tm1 = 3.7629e-55, Tm9-Tm2 = 5.3286e-42, Tm1-Tm2 = 0,1239. c Bar graphs illustrating the % of columns in which a presynaptic input is present for Tm9, Tm1, and Tm2. d, e Violin plots of the relative synaptic counts of Tm inputs (d), and of the absolute synaptic counts of the first three major inputs to Tm neurons (e), showing the median (white dot), the interquartile range (thick gray bar), 1.5x interquartile range (thin gray line) and outliers. Neurons with more than 10% contribution of all synapse counts are color-coded. n = 166 Tm9/Tm1/Tm2 (from the same columns).

