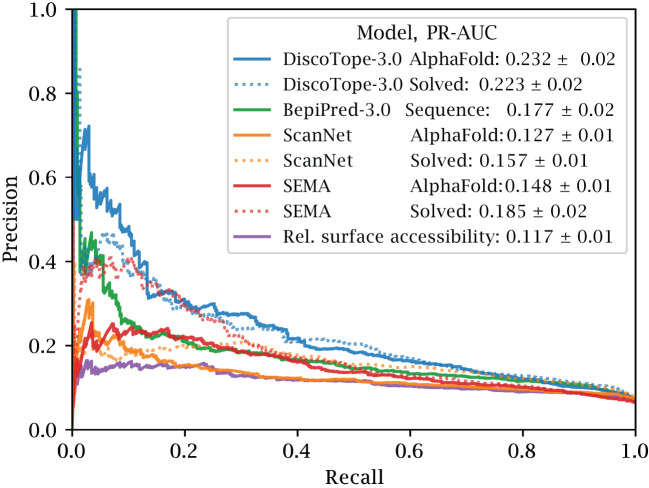
Figure 3.
Improved performance on solved and predicted structures. AUC-PR curve plots on the external test set of 24 antigen chains, at most 20% similar to the training set of all models. Structures provided as AlphaFold predicted, experimentally solved, or sequence in the case of BepiPred-3.0. Standard deviation calculated from bootstrapping 1000 times (see Methods). See Supplementary Figure S2 and Table 2 for additional performance metrics. Please see BepiPred-3.0 publication (5) for its improved performance versus DiscoTope-2.0, epitope3D, Seppa-3.0 and ElliPro.

