. 2024 Jan 12;15(8):2833–2847. doi: 10.1039/d3sc05937e

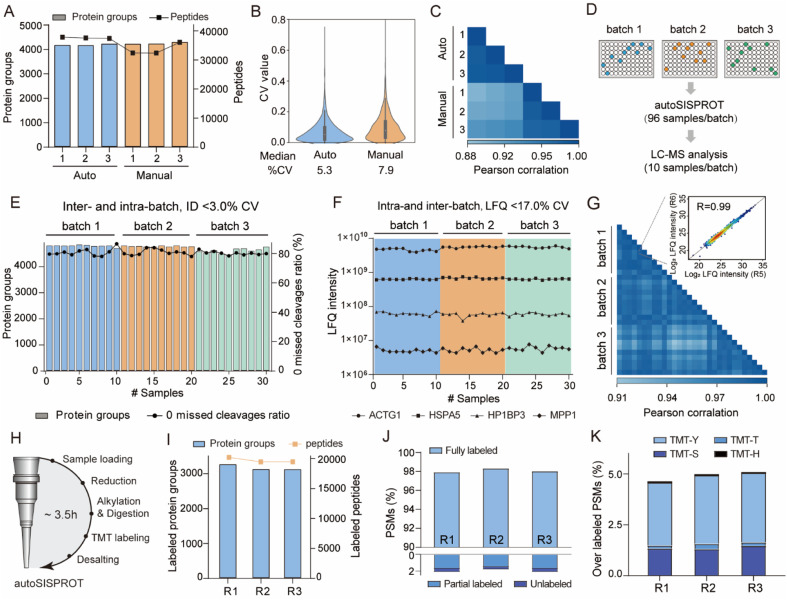
Fig. 3. Performance of autoSISPROT. (A) The number of identified protein groups and peptides using autoSISPROT and manual SISPROT under three technical replicates. (B) Violin plots showing the distributions of CVs of protein LFQ intensities between autoSISPROT and manual SISPROT under three technical replicates. (C) Correlation of LFQ intensities of quantified proteins under three technical replicates. (D) Schematic representation of the experimental design. 96-well plates with 10 μg of HEK 293T cell lysates are processed in three batches on three different days. From each batch, ten randomly selected samples are subjected to LC-MS/MS analysis. (E) Protein groups and percentage of PSMs with zero missed cleavages across the three batches. (F) LFQ intensities of four proteins representing the different dynamic ranges are plotted across the three batches. (G) Pearson correlation coefficient of protein LFQ intensities for inter-batch comparison, and the displayed data are filtered for 75% data completeness. The inset graph shows a high correlation (>0.99) between replicate 5 and replicate 6 of batch 1. (H) The workflow for autoSISPROT that integrated TMT labeling. (I) Protein groups and peptide identifications across analytical duplicates. (J) TMT labeling efficiency was evaluated using the proportions of fully labeled, partial, and unlabeled PSMs. (K) Overlabeling efficiency was evaluated using the proportions of serine, threonine, tyrosine and histidine labeled PSMs.

Fig. 3