. 2024 Jan 24;15(8):2731–2744. doi: 10.1039/d3sc06734c

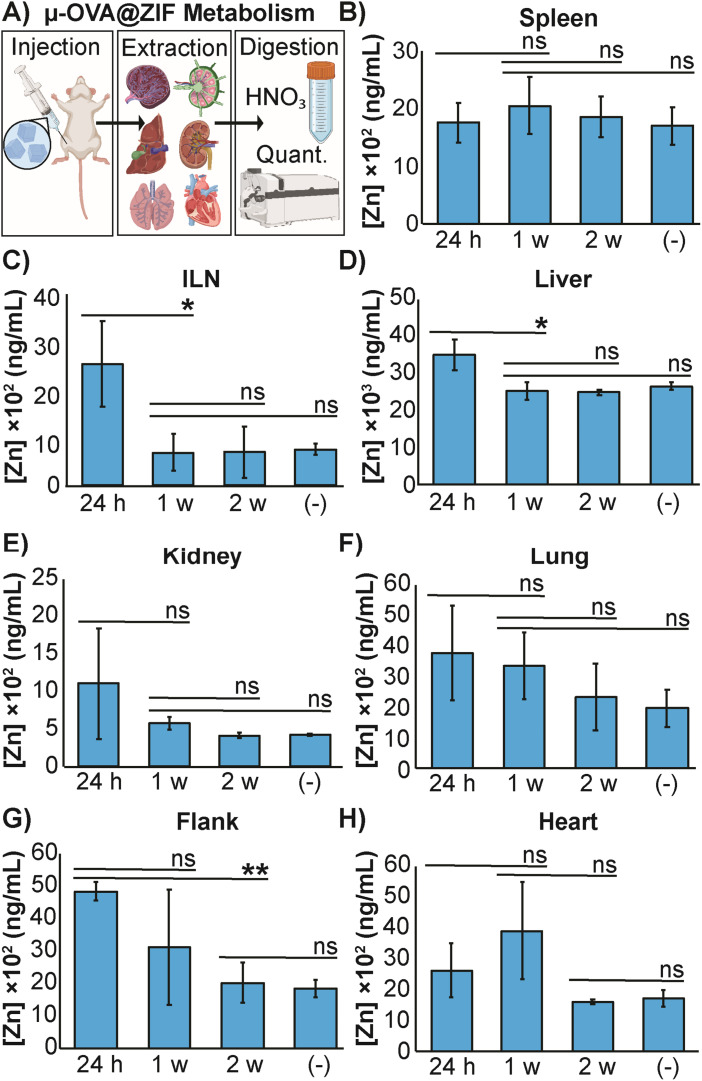
Fig. 5. Distribution of zinc released from μ-OVA@ZIF. (A) Representative scheme illustrating the vaccination, organ extraction, sample digestion, followed by quantification of Zn2+ through ICP-MS. The concentration of Zn2+ in the (B) spleen, (C) ILN, (D) liver, (E) kidneys, (F) lungs, (G) flank and (H) heart of female BALB/c mice (n = 3) following vaccination with μ-OVA@ZIF. Organs were extracted at 24 h, 1 w, and 2 w post inoculation. (−) denotes the negative control consisting of unvaccinated mice (n = 3). Statistical significance was determined by an unpaired Student's t-test (P > 0.05 is ns, P ≤ 0.05 is *, P ≤ 0.01 is **, P ≤ 0.001 is ***, and P ≤ 0.0001 is ****).

Fig. 5