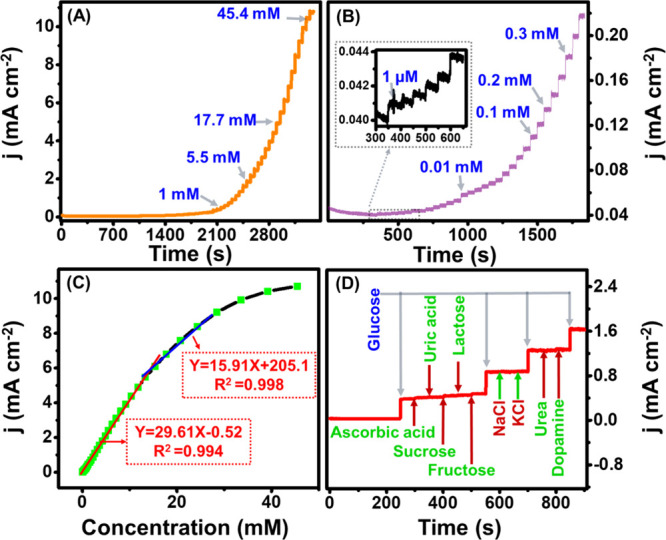
Figure 8.

Sensing performance study of the Cu2O/M/AC composite. (A) Amperometric response, (B) expanded view of lower concentrations, (C) linear fitting curve of glucose concentration vs current, and (D) selectivity study using 1 mM glucose concentration along with 0.1 mM of other analytes (inset of panel B is the amperometric response in 1 μM glucose concentration).
