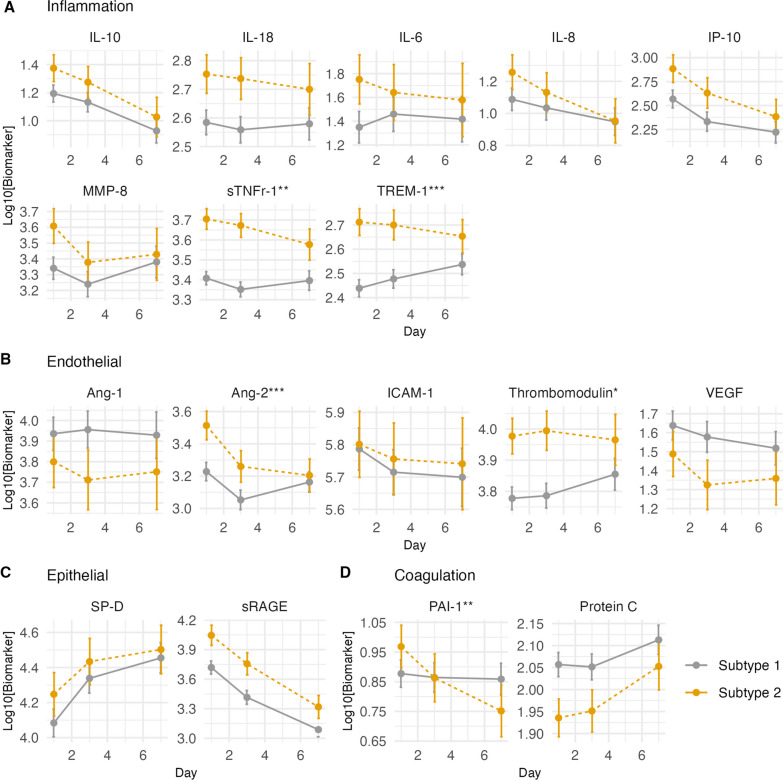
Fig. 3.
Change in log10 biomarker concentration over time by subtype assignment in the control arm (N = 142). A Biomarkers of inflammation, B endothelial injury, C alveolar epithelial injury, and D disordered coagulation. Y-axis is the log10 concentration of biomarker. Estimates with 95% confidence intervals derived from linear mixed effects models. Asterisks denote significant difference in the slope of biomarker change over time between Subtype 1 and Subtype 2 based on Chi-squared test of interaction. *p value < 0.05. **p value < 0.005. ***p value < 0.001

