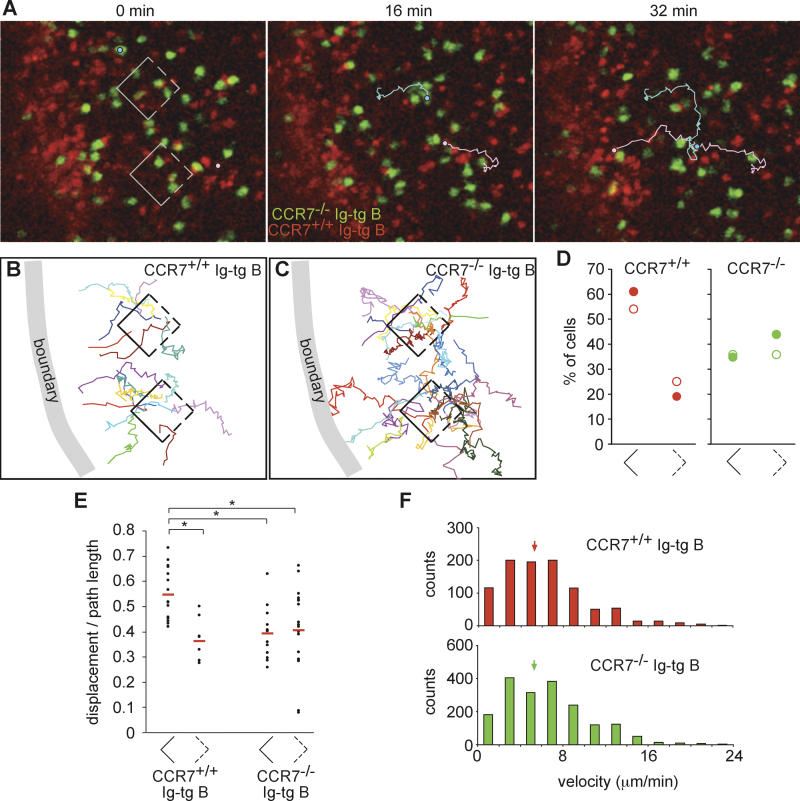
Figure 4. Antigen-Engaged CCR7−/− B Cells Fail to Show Directional Migration toward the Follicle–T Zone Boundary.
(A) Time-lapse images of HEL-engaged CCR7−/− (green) and CCR7+/+ (red) Ig-tg B cells in an inguinal lymph node. The 0-min image is ~3.5 h after antigen exposure (see Video S4). Square boxes indicate regions used for directionality analysis, shown in (B). A CCR7−/− Ig-tg B cell (light blue circle and line) and a CCR7+/+ Ig-tg B cell (pink circle and line) are traced as examples.
(B and C) Tracks of antigen-engaged CCR7+/+ (B) and CCR7−/− (C) Ig-tg B cells originating from 30-μm follicular cubes, analyzed as described in Figure 2. Tracks cover 3–17 min for CCR7+/+ cells and 3–22 min for CCR7−/− cells.
(D) Dot plot showing the percentage of cells that moved across the solid or dashed sides of the cubes. Filled symbols correspond to the data shown in (A–C) and Video S4, open symbols correspond to data obtained in a second time-lapse movie collected 2.5–3.5 h after antigen injection. The cubes were located approximately 20–80 μm from the site of accumulation of CCR7+/+ Ig-tg B cells.
(E) The dot plots show ratios of the displacement to the path length of 8-min tracks of antigen-engaged CCR7+/+ or CCR7−/− Ig-tg B cells originating from the cubes described in (A–D). The left and right plots for each cell graph are the data of tracks that cross the solid and dashed sides of the cubes, respectively. A total of 74% of wild-type B cells and 81% of CCR7−/− B cells that crossed the sides of the cubes could be tracked for 8 min. The means of each data group are shown as red bars. *, p < 0.01.
(F) Velocity distribution data for CCR7−/− Ig-tg B cells (green, n = 27) and CCR7+/+ Ig-tg B cells (red, n = 40) tracked 2.5–4.2 h after antigen injection. The data are pooled from two time-lapse movies. Medians are indicated by arrows.

