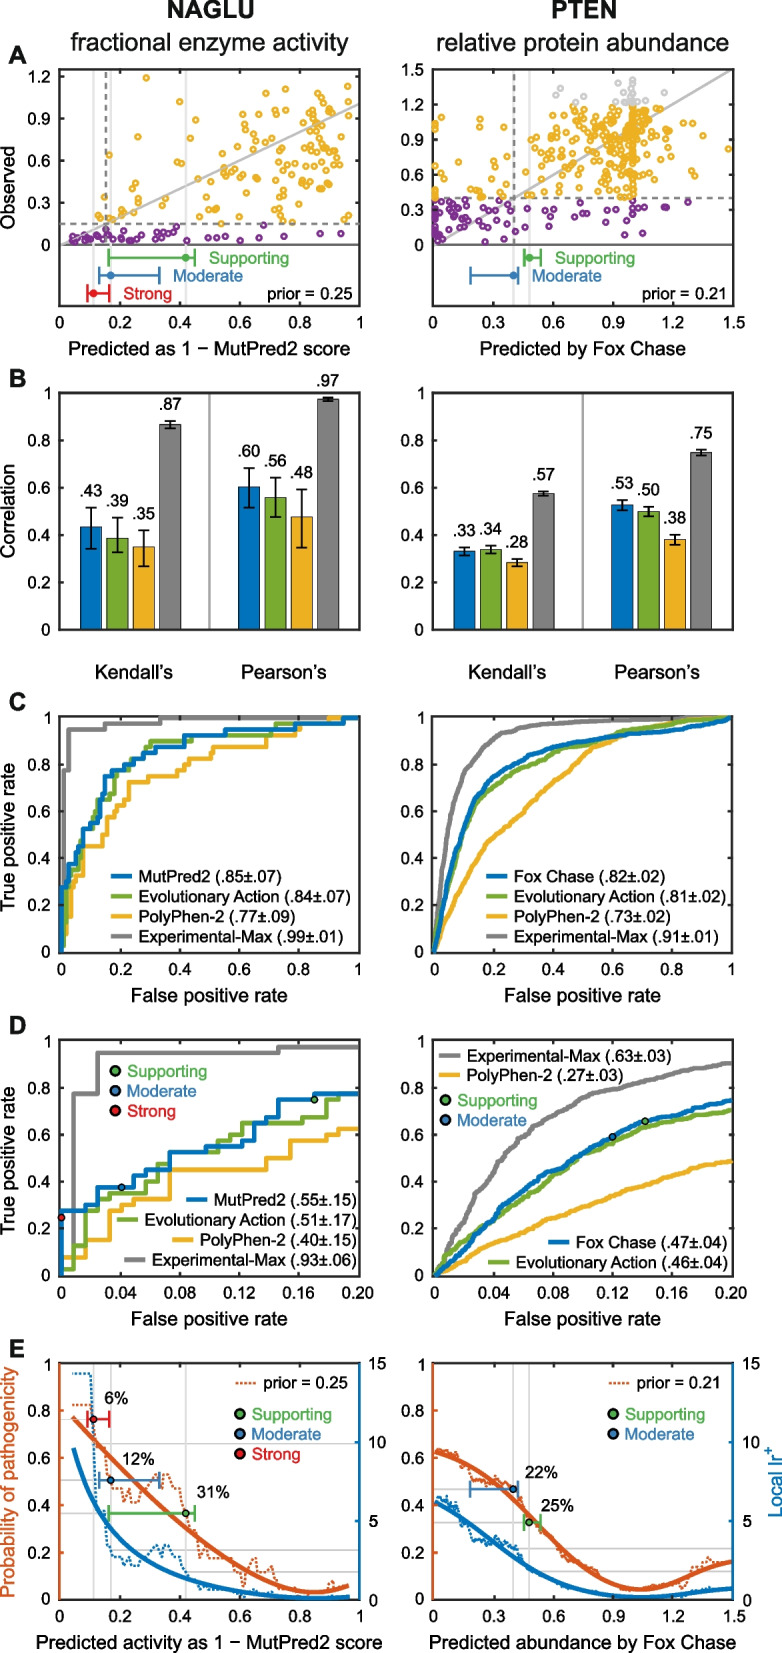
Fig. 2.

Predicting the effect of missense variants on protein properties: Results for two example CAGI challenges. Each required estimation of continuous phenotype values, enzyme activity in a cellular extract for NAGLU and intracellular protein abundance for PTEN, for a set of missense variants. Selection of methods is based on the average ranking over four metrics for each participating method: Pearson’s correlation, Kendall’s tau, ROC AUC, and truncated ROC AUC; see “Methods” for definitions. A Relationship between observed and predicted values for the selected method in each challenge. “Benign” variants are yellow and “pathogenic” are purple (see text). The diagonal line represents exact agreement between predicted and observed values. Dashed lines show the thresholds for pathogenicity for observed (horizontal) and predicted biochemical values (vertical). For NAGLU, below the pathogenicity threshold, there are 12 true positives (lower left quadrant) and three false positives (upper left quadrant), suggesting a clinically useful performance. Bars below each plot show the boundaries for accuracy meeting the threshold for Supporting (green), Moderate (blue), and Strong (red) clinical evidence, with 95% confidence intervals. B Two measures of overall agreement between computational and experimental results, for the two selected performing methods and positive and negative controls, with 95% confidence intervals. An older method, PolyPhen-2, provides a negative control against which to measure progress over the course of the CAGI experiments. Estimated best possible performance is based on experimental uncertainty and provides an empirical upper limit positive control. The color code for the selected methods is shown in panel C. C ROC curves for the selected methods with positive and negative controls, using estimated pathogenicity thresholds. D Truncated ROC curves showing performance in the high true positive region, most relevant for identifying clinically diagnostic variants. The true positive rate and false positive rate thresholds for the Supporting, Moderate, and Strong evidential support are shown for one selected method. E Estimated probability of pathogenicity (left y-axis) and positive local likelihood ratio (right y-axis) as a function of one selected method’s score. Predictions with probabilities over the red, blue, and green thresholds provide Strong, Moderate, and Supporting clinical evidence, respectively. Solid lines show smoothed trends. Prior probabilities of pathogenicity are the estimated probability that any missense variant in these genes will be pathogenic. For NAGLU, the probabilities of pathogenicity reach that needed for a clinical diagnosis of “likely pathogenic.” For predicted enzyme activity less than 0.11, the probability provides Strong evidence, below 0.17 Moderate evidence, and below 0.42, Supporting evidence. The percent of variants encountered in the clinic expected to meet each threshold are also shown. Performance for PTEN shows that the results are consistent with providing Moderate and Supporting evidence levels for some variants
