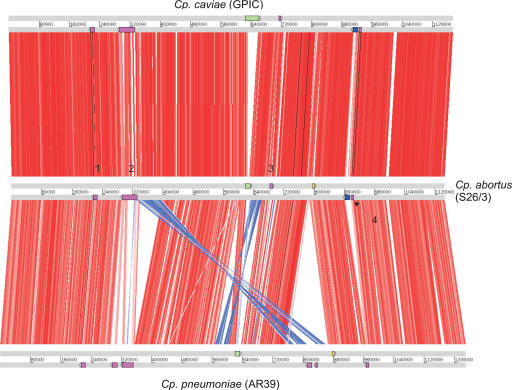
Figure 2.
Global comparison between Cp. caviae (GPIC), Cp. abortus (S26/3), and Cp. pneumoniae (AR39). The figure shows ortholog matches (see Methods; displayed using ACT http://www.sanger.ac.uk/Software/ACT/) of the three sequenced Chlamydophila genomes. Gray bars represent the forward and reverse strands of DNA with the scale marked in base pairs. The red bars between the DNA lines represent individual forward ortholog matches, with inverted matches colored blue. The positions of the PZ region (green), pmp clusters (purple; numbered 1–4), tmh cluster (blue), and biotin biosynthetic operon (yellow) are shown as colored boxes on the DNA lines. All the genomes have been oriented at the origin of replication to start at the hemB gene.

