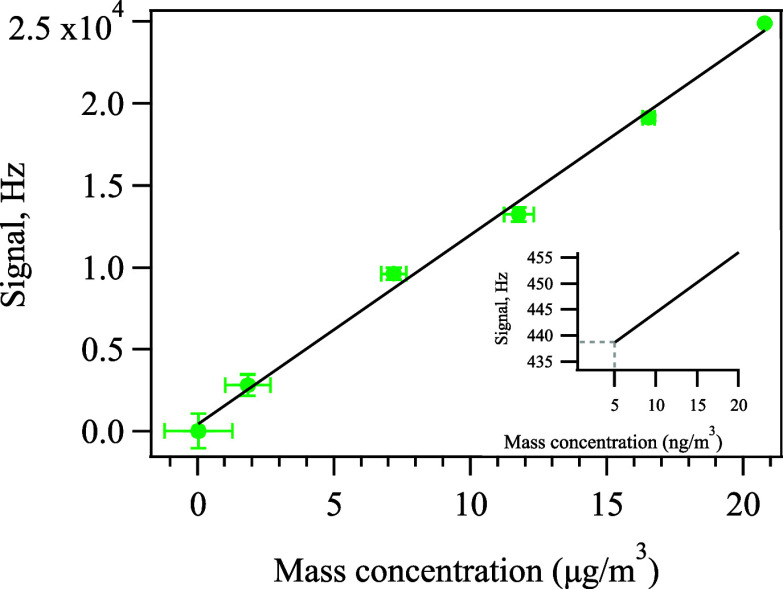
Figure 2.
Calibration curve of PS particles with a slope value of 1.155 × 10³ Hz/(μg/m3) and R2 = 0.995. The x-axis is the mass concentration of PS particles calculated based on the CPC measurements, and the y-axis shows the organics signal measured by the AMS. Inset: the vertical dashed line represents the detection limit calculated based on the calibration curve, while the horizonal dashed line represents the 3σ of the noise averaged over 1-h period.

