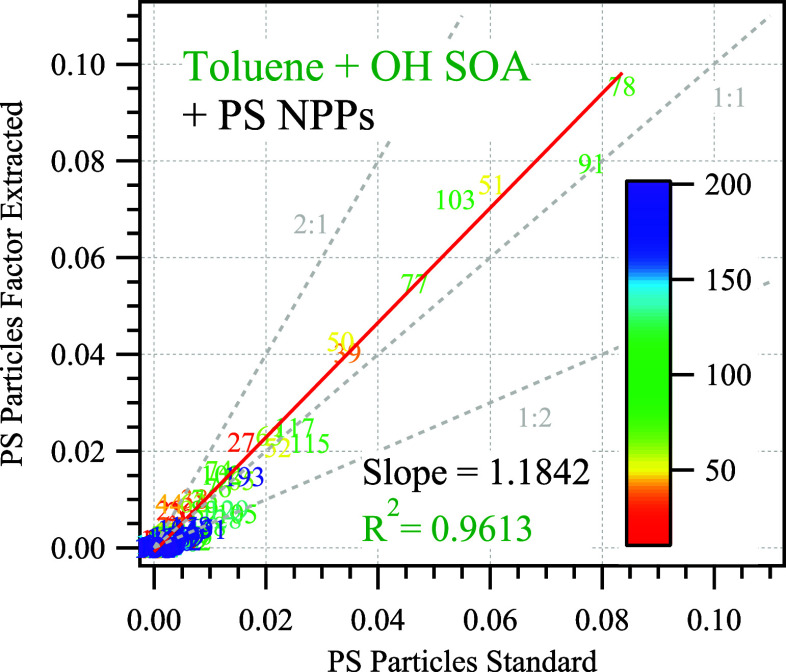
Figure 3.
Scatter plot of normalized HR organic ion signal of PS particles from the factor extracted from PMF (y axis) versus the pure standard (x axis) for the binary mixture system containing toluene SOA and PS particles. The numbers are the m/z from the mass spectra. The color bar represents the values of the m/z from the mass spectrum in ascending order.

