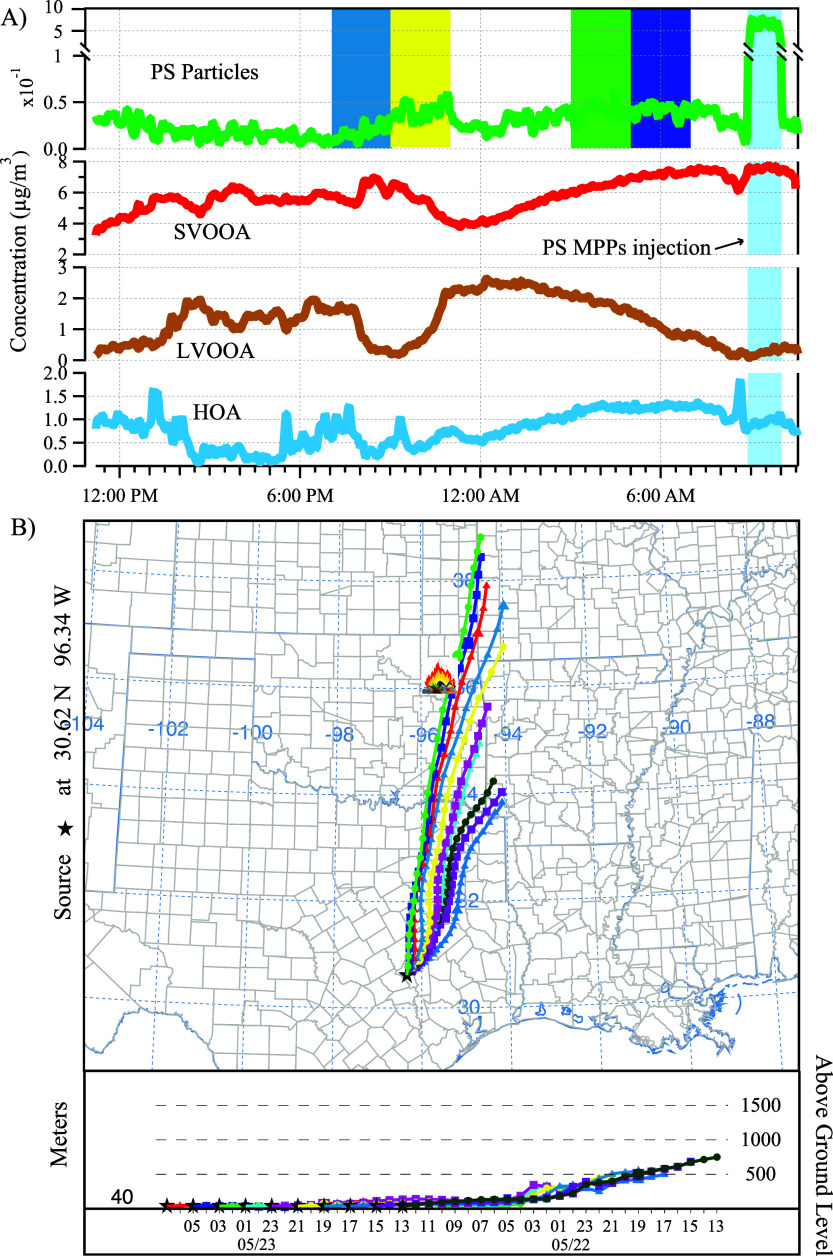
Figure 4.
The time series of each factor identified during ambient1 from the ME-2 analysis (A), and the 24 h backward trajectories of air masses arriving at the sampling inlet (B) at 40 m above ground level during ambient1. The trajectories were retrieved every 2 h to elaborate the trend of derived PS factor. In Panel A, the four intervals during which the backward trajectories passed in close proximity to the waste incinerator were highlighted with the same color as their corresponding trajectories in Panel B. The legend and air mass height at the bottom of Panel B show the arrival time of the air mass at the sampling site every 2 h. These four intervals showed elevated nanoplastic concentrations.

