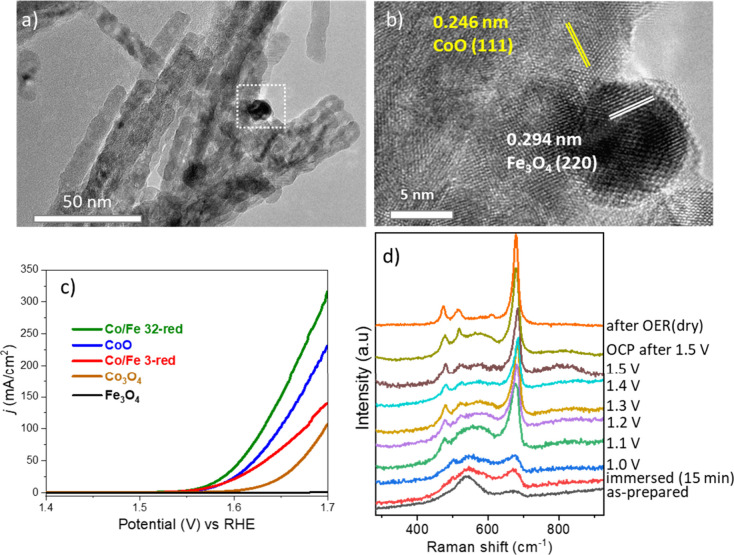
Figure 6.
(a, b) TEM and HR-TEM images of reduced, iron oxide nanoparticle supported CoO nanowires, (c) LSV curves of reduced CoO and CoFe oxides with Co/Fe ratios of 32 and 3 (denoted as Co/Fe 32-red and Co/Fe 3-red, respectively), pristine Co3O4, and Fe3O4 in 1 M KOH electrolyte. In situ electrochemical Raman spectra of the Co/Fe 32-red sample, whereby transformation of CoO into Co3O4 at higher applied potential could be monitored. Reproduced with permission from ref (1). Copyright 2022 American Chemical Society.

