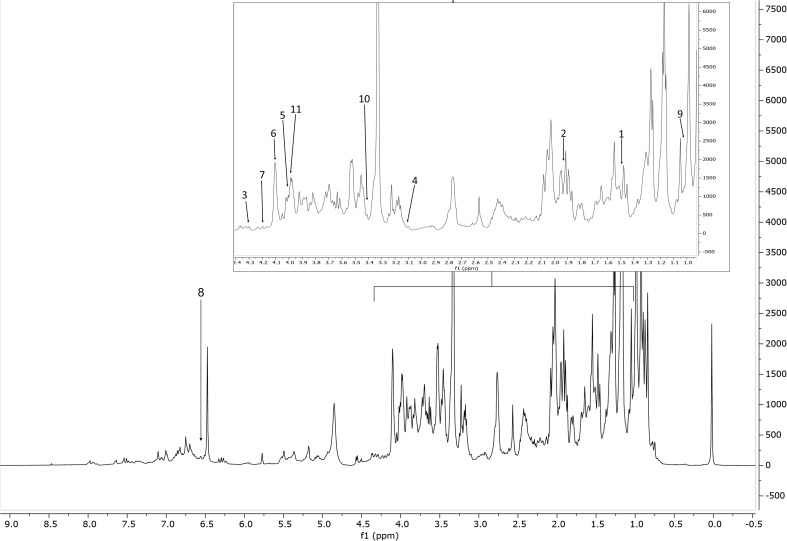
Figure 2.
Representative 1H NMR spectrum of the extract of S. rosmarinus (accession 2, Supplementary Table S1 ), from δ H 0.0 to 8.5 ppm with annotation of the metabolites of the Chenomx 500 MHz version 11 library (CL). Region δ H 0.9–4.4 (dotted box) was expanded. The peaks used for quantification of the identified metabolites are annotated with numbers. Keys: 1, alanine; 2, acetate; 3, malate; 4, malonate; 5, choline; 6, fructose; 7, sucrose; 8, fumarate; 9, valine; 10, proline; 11, asparagine.

