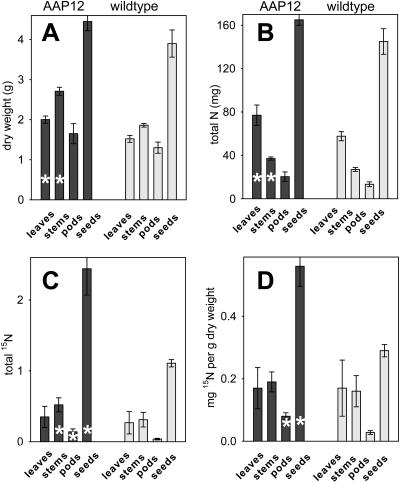
Figure 9.
Dry matter distribution between organs and allocation of [15N] tracer in plants of line AAP-12 and wild type. Labeling has been done at 29 DAP (first flower). Plants were held in soil. [15N]-NH4Cl (200 mL of 6 mm) was applied onto the pots to the root system at 29 DAP (first flower). Four days after application, all plant organs were harvested, dried at 60°C, and analyzed. A, Biomass (dry weight). B, Total nitrogen. C, Total content of [15N] label in different organs. D, Concentration of [15N] label in different organs. Asterisk, Significant differences according to Student's t test, P < 0.05, n = 5.

