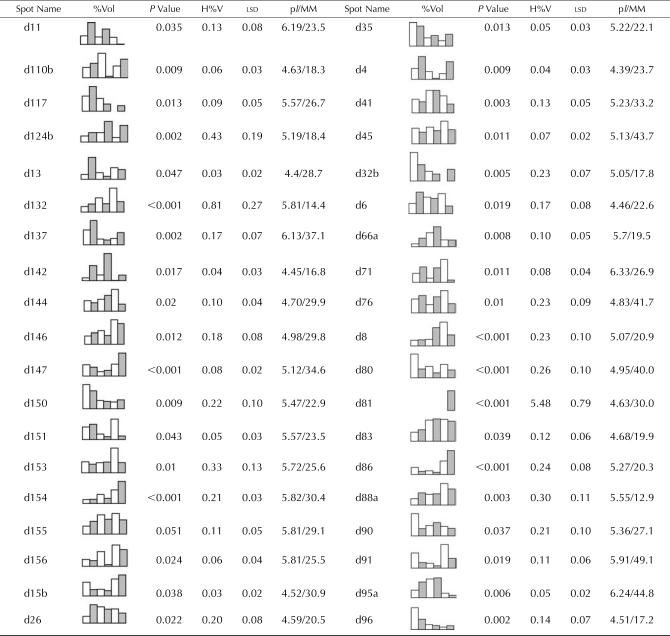
Table II.
Unidentified M. truncatula proteins whose expression levels changed between Jemalong and 2HA during 2, 5, and 8 weeks of tissue culture
Each entry contains an identifier/spot name, which corresponds to the protein spots marked in Figure 2. Graphical representation of relative expression (%Vol) is given for each protein spot that showed significant differences. The columns in the graphs from left to right are: Jemalong 2 weeks (white), 2HA 2 weeks (shaded), Jemalong 5 weeks (white), 2HA 5 weeks (shaded), Jemalong 8 weeks (white), and 2HA 8 weeks (shaded). For each comparison, the P value, the highest %Vol of the six treatments (H%V), and the lsd are given. The pI and relative molecular mass (MM; kD) were calculated from the position on the 2-DE gel.

