FIGURE 3.

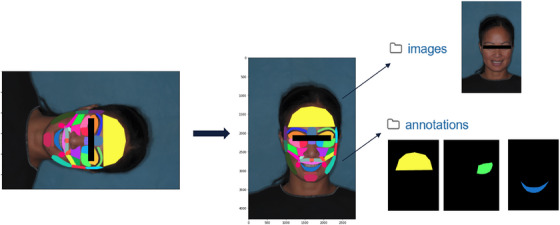
Schematic illustration of the preprocess pipeline, showing (left to right) the annotated high‐resolution image, the same image properly oriented, and the separation of image and annotation mask data.

Schematic illustration of the preprocess pipeline, showing (left to right) the annotated high‐resolution image, the same image properly oriented, and the separation of image and annotation mask data.