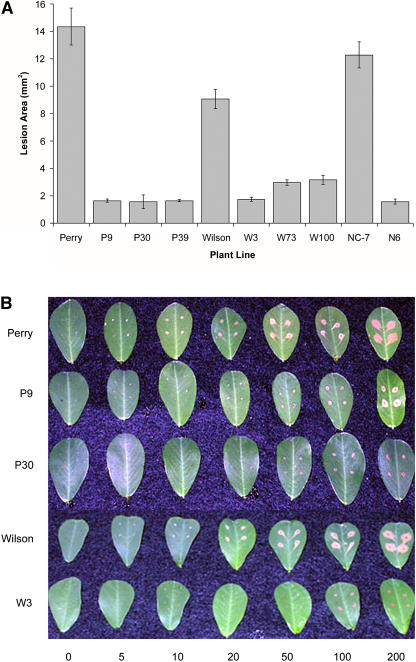
Figure 5.
Resistance to oxalic acid in control and transformed peanut. A, Bar graph showing lesion size (in mm2) for transformed lines and nontransformed controls following application of 200 mm oxalic acid to peanut lines. B, Photograph of selected peanut lines showing lesion size and appearance on detached leaflets after application of increasing amounts of oxalic acid. Means and se are shown for four replicates.

