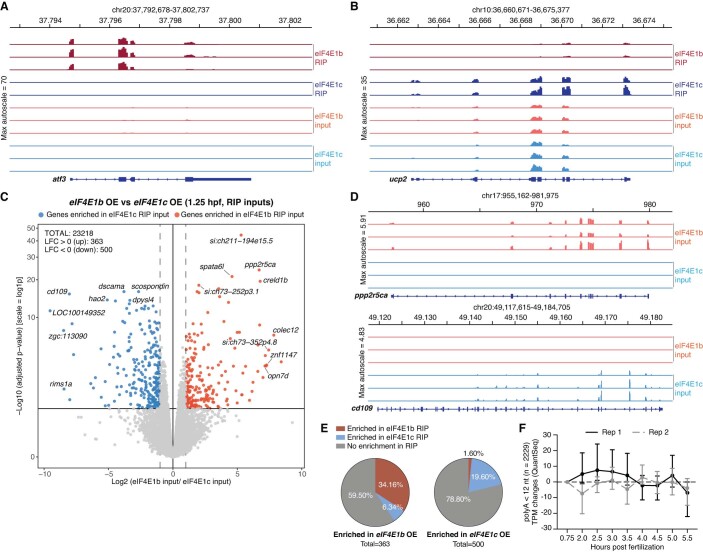
Figure EV5. Additional RNA immunoprecipitation (RIP) and RNA sequencing (RNA-seq) analyses.
(A, B) Examples of mapped RNA-seq reads of differentially expressed genes (DEGs) in eIF4E1b (A) and eIF4E1c (B) RIPs performed at 1.25 hours post fertilization (hpf). (C) DEG analyses of mRNAs isolated from total lysates (inputs from RIP experiments) of 8-cell stage embryos expressing 3xflag-sfGFP tagged eIF4E1b or eIF4E1c under the control of the actb2 promoter (eIF4E1b or eIF4E1c OE, respectively). mRNAs enriched in eIF4E1b OE and eIF4E1c OE are shown in red and blue, respectively. Statistical significance was determined using Benjamini-Hochberg-corrected Wald test (DeSeq2; P value < 0.005; n = 3 biological replicates). (D) Mapped RNA-seq reads of example genes specifically upregulated in eIF4E1b (top) or eIF4E1c (bottom) OE 8-cell embryos. (E) Fraction of transcripts significantly upregulated in eIF4E1b OE (left) or eIF4E1c OE (right) embryos that were also enriched in eIF4E1b and eIF4E1c RIPs at 1.25 hpf (P value < 0.05). (F) Changes in mRNA levels (in transcripts per million, TPM) of transcripts with polyA tails containing less than 12 nucleotides during zebrafish embryogenesis according to published RNA-seq data (Bhat et al, 2023). Medians (dots) with interquartile ranges (bars) are shown.

