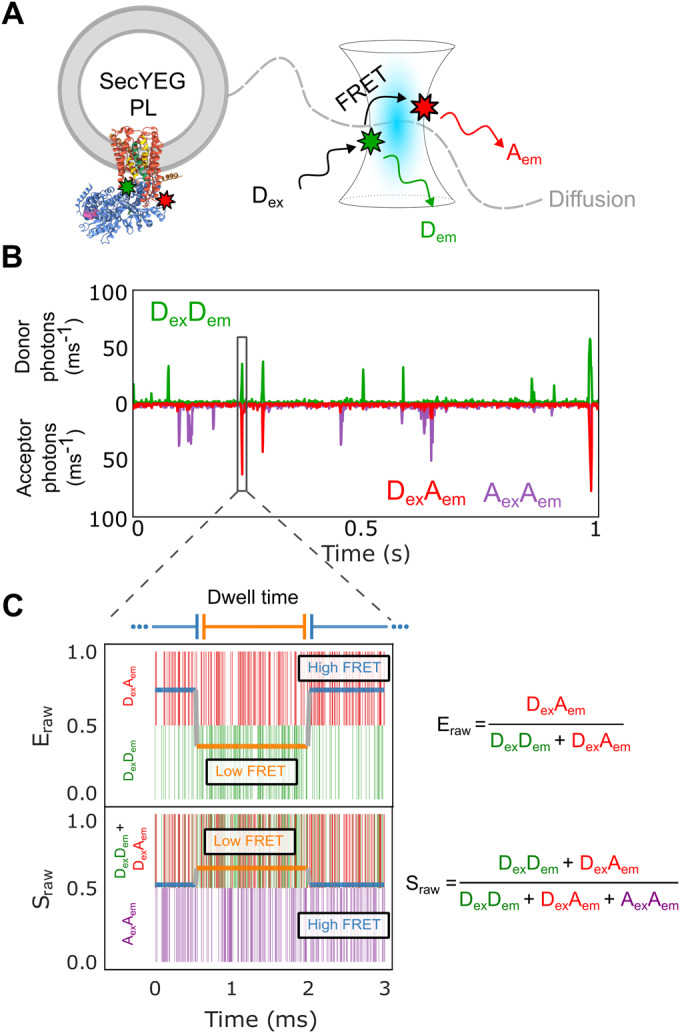
Figure 2. Single-molecule FRET methodology.

(A) Confocal volume with illustration of a single proteoliposome (PL) with embedded SecYEG diffusing in and out of the confocal volume alongside. The positions of the dyes are indicted using green/red stars. Note that SecYEG is shown in a single orientation here, but inserts equally in both orientations into the liposomes under the conditions used (Deville et al, 2011). Hence only ~50% of molecules will bind SecA in the experiments presented (see Methods). (B) A representative single-molecule time trace showing photons from the DexDem (Donor Excitation, Donor Emission) in green, DexAem (Donor Excitation, Acceptor Emission) in red, and AexAem (Acceptor Excitation, Acceptor Emission) in purple. (C) A single-molecule photon time trace of a single burst. Photon timestamps are represented by coloured vertical bars (not related to the y-axis). The most likely state path as identified by the Viterbi algorithm as derived by mpH2MM is overlaid as two horizontal coloured lines relating to the y-axis for both Eraw and Sraw.
