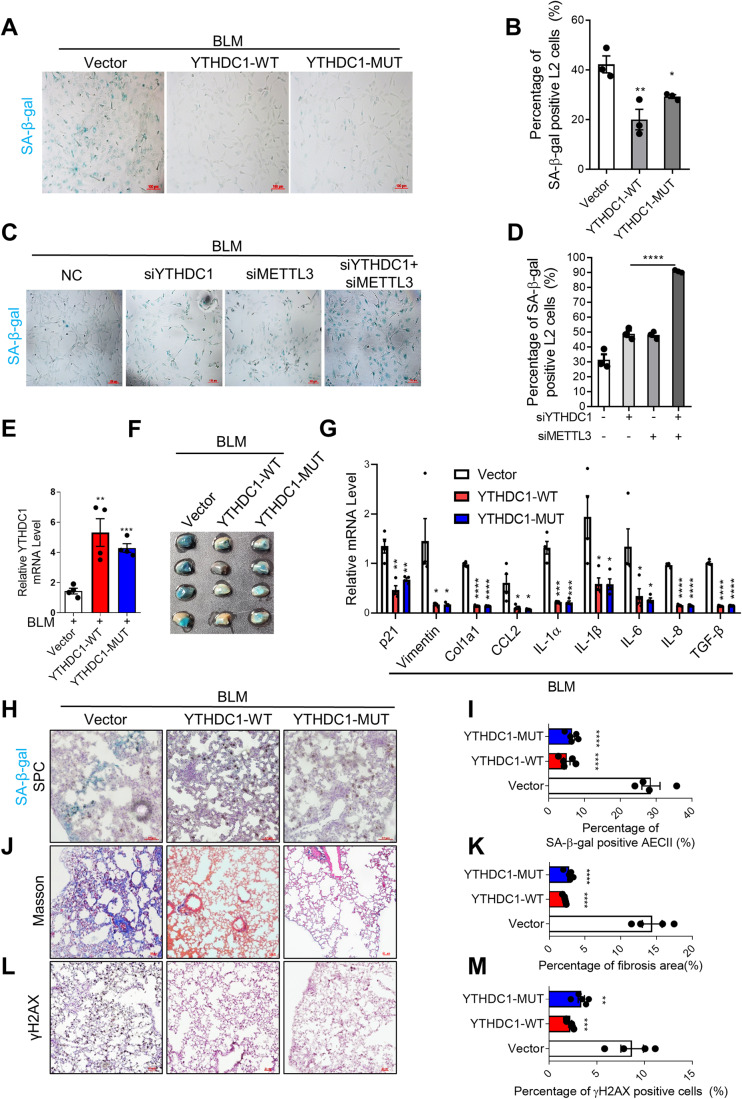
Figure 2. Overexpression of YTHDC1 attenuates bleomycin-induced pulmonary senescence and fibrosis.
(A) SA-β-gal staining of L2 cells overexpressed with Vector, YTHDC1-WT or YTHDC1-MUT. Forty-eight hours after transfection, cells were treated with BLM for 4 days and subjected to SA-β-gal staining. Scale bars: 100 μm. (B) Quantification of A. The percentage of SA-β-gal positive cells was calculated (n ≥ 100 cells × three repeats). (C) SA-β-gal staining of L2 cells transfected with indicated siRNAs. Forty-eight hours after transfection, cells were treated with BLM for 4 days and subjected to SA-β-gal staining. Scale bars: 100 μm. (D) Quantification of C. The percentage of SA-β-gal positive cells was calculated (n ≥ 100 cells × three repeats). (E) YTHDC1 expression level in mice lungs. C57/BL6 mice transfected with indicated AAV vectors were treated with BLM for 7 days (n ≥ 4 per group). YTHDC1 mRNA was analyzed by RT-qPCR. (F) Lungs from mice in panel E were used for SA-β-gal staining. (n ≥ 4 per group). (G) SASP factors were detected by RT-qPCR using mice lungs from panel E. (n ≥ 4 per group). (H) Representative images of SPC IHC with SA-β-gal staining in the mice lungs from panel E. (n ≥ 4 per group). Scale bar: 50 μm. (I) Quantification of panel H. The percentage of double-positive cells in SPC-positive cells was calculated. (J) Masson’s trichrome was performed to determine the level of fibrosis in the mice lungs from panel E. (n ≥ 4 per group). Scale bar: 100 μm. (K) Quantification of panel J. The percentage of fibrosis area (blue) was quantified. (L) Representative images of γH2AX IHC in the mice lungs from panel E. (n ≥ 4 per group). Scale bar: 50 μm. (M) Quantification of panel L. The percentage of γH2AX positive cells was calculated. Data information: All values are mean ± SEM. The One-way ANOVA was used to determine the statistical significance (*P < 0.05, **P < 0.01, ***P < 0.001, ****P < 0.0001). n = number of biological replicates. Source data are available online for this figure.

