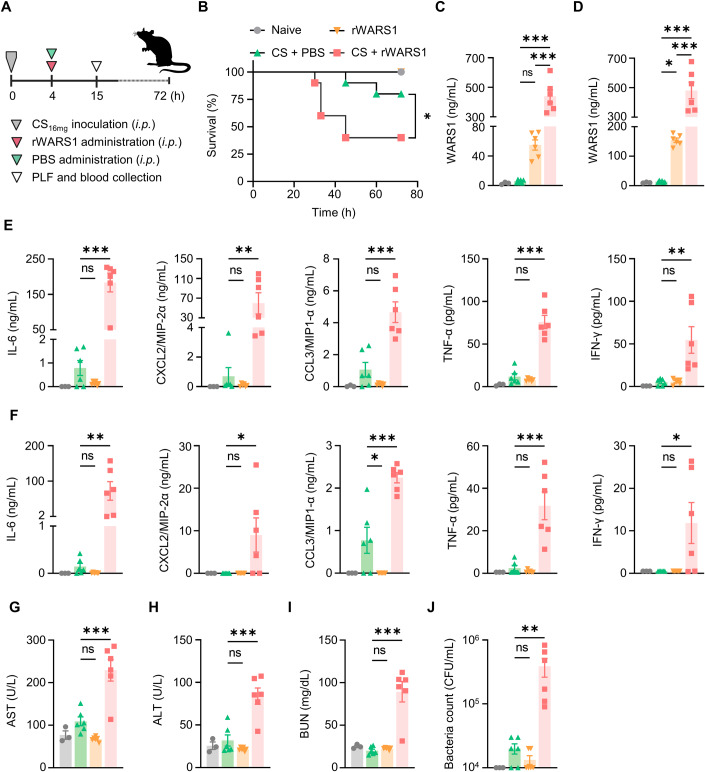
Figure 4. WARS1 administration exacerbates cytokine and chemokine production, organ damages, and mortality in septic mice.
(A) Experimental scheme of CS16mg inoculated mild septic mouse model. (B) Kaplan–Meier survival plot for mice administered with PBS or rWARS1 (20 mg/kg) after CS16mg inoculation, naive mice were administered with PBS (n = 10 per group). (C, D) WARS1 levels in PLF (C) and plasma (D) at 15 h after CS inoculation (n = 3–6 per group). (E, F) Levels of cytokine and chemokine in PLF (E) and plasma (F) at 15 h after CS inoculation (n = 3–6 per group). (G–J) Serum levels of AST (G), ALT (H), BUN (I), and blood bacterial CFU (J) at 15 h after CS inoculation (n = 3–6 per group). Data information: Data are presented as mean ± SEM (C–J). Statistical analysis is performed with log-rank test (B), and ANOVA with Bonferroni corrections (C–J). ns, not significant; *p < 0.05, **p < 0.01, ***p < 0.001. Source data are available online for this figure.

